Augmented Analytics Market Size & Growth Forecast 2027–2036, By Segments (Component, Enterprise Size, Deployment Type, Vertical), Regional Demand Trends (North America, Asia Pacific, Europe), Key Country Insights (U.S., Japan, South Korea, Germany, France, Italy), and Competitive Landscape
Market Size and Growth Outlook
Augmented Analytics Market size was worth USD 38.5 billion in 2026 and is expected to grow at a 26.6% CAGR between 2027 and 2036, attaining USD 407.19 billion by 2036. The industry revenue for 2027 is assessed at USD 47.12 billion.
Get more details on this report
Request Free Sample ReportAugmented Analytics Market Intelligence Snapshot
Regional Market Dynamics
- North America leads with 43.67% share due to mature cloud-based BI adoption, strong enterprise AI integration, and large-scale structured and unstructured data environments supporting advanced analytics.
- Asia Pacific is expanding at 30.14% CAGR due to rising cloud adoption, increased AI investment, and demand for automated insights reducing reliance on scarce data science expertise across enterprises.
Segment Momentum
- Software held a 76.48% market share in 2026 because it serves as the primary platform for automated insights, data preparation, and analytics workflows, making it the core area of organizational investment.
- SMEs are adopting augmented analytics rapidly as tools become easier to use and help generate insights without large analytics teams, making advanced decision support more accessible for lean organizations.
Market Expansion Drivers
- Increasing enterprise demand for automated insights from complex and high-volume business datasets.
- AI, ML, and NLP integration democratizing analytics access across SMEs and large enterprises.
- Rising cloud-based analytics adoption improving real-time operational decision intelligence capabilities.
Leading Market Participants
- Prominent companies in the augmented analytics market include Microsoft Corporation (United States), International Business Machines Corporation (United States), Oracle Corporation (United States), SAP SE (Germany), Salesforce, Inc. (United States), QlikTech International AB (United States), SAS Institute Inc. (United States), MicroStrategy Incorporated (United States), ThoughtSpot, Inc. (United States), Sisense Ltd. (United States).
Global Market Forecast Snapshot
Market Outlook
- 2026 Market Size: USD 38.5 billion
- 2027 Estimated Market Size: USD 47.12 billion.
- Projected Market Size: USD 407.19 billion by 2036
- Growth Forecast: 26.6% CAGR (2027-2036)
Regional and Segment Outlook
- Leading Regional Market: North America
- High-Growth Regional Hub: Asia Pacific
- Core Revenue Segment: Software (Component) | Large Enterprises (Enterprise Size) | Cloud (Deployment Type) | BFSI (Vertical)
- Emerging Opportunity Segment: Services (Component) | Small & Medium-sized Enterprises (SMEs) (Enterprise Size) | On-premise (Deployment Type) | Retail & E-commerce (Vertical)
Market Growth Drivers and Industry Trends
Increasing enterprise demand for automated insights from complex and high-volume business datasets
The growing complexity of enterprise information environments is driving the augmented analytics market as organizations seek automated methods to extract meaningful insights from large and diverse datasets. Augmented analytics platforms can automate activities such as data preparation, pattern identification, anomaly detection, and insight generation, reducing the manual effort traditionally associated with analytical workflows. This capability is particularly valuable for enterprises managing information across multiple business functions, where rapidly identifying relevant trends and relationships can support faster evaluation of operational and commercial performance.
AI, ML, and NLP integration democratizing analytics access across SMEs and large enterprises
Integration of artificial intelligence, machine learning, and natural language processing is expanding the augmented analytics market by making analytical capabilities easier to access for users with different levels of technical expertise. AI and ML can identify patterns and generate insights automatically, while NLP allows users to interact with analytical systems through more intuitive language-based queries. These capabilities reduce reliance on specialized data teams for routine analytical tasks and enable business users across SMEs and large enterprises to explore information, interpret findings, and incorporate data-driven insights into their regular workflows.
Rising cloud-based analytics adoption improving real-time operational decision intelligence capabilities
Increasing migration toward cloud-based analytical environments will propel the augmented analytics market growth as enterprises require faster access to continuously changing operational information. Cloud platforms provide flexible computing and data-processing resources that allow organizations to analyze information across distributed applications and business systems without relying solely on localized infrastructure. When combined with augmented analytics capabilities, these environments can support near-real-time identification of operational changes, emerging patterns, and performance issues, helping decision-makers evaluate current business conditions through more responsive analytical workflows.
| Growth Driver | Impact on CAGR | Regulatory Influence | Geographic Relevance | Adoption Rate | Impact Timeline |
|---|---|---|---|---|---|
| Increasing enterprise demand for automated insights from complex and high-volume business datasets | 2.30% | Moderate | North America, Europe | High | Near Term |
| AI, ML, and NLP integration democratizing analytics access across SMEs and large enterprises | 2.00% | Moderate | North America, Asia Pacific | High | Mid Term |
| Rising cloud-based analytics adoption improving real-time operational decision intelligence capabilities | 1.70% | Low | Asia Pacific, Latin America | Emerging | Long Term |
Unlock insights tailored to your business with our bespoke market research solutions.
Click to get your customized report now.
Regional Demand Dynamics
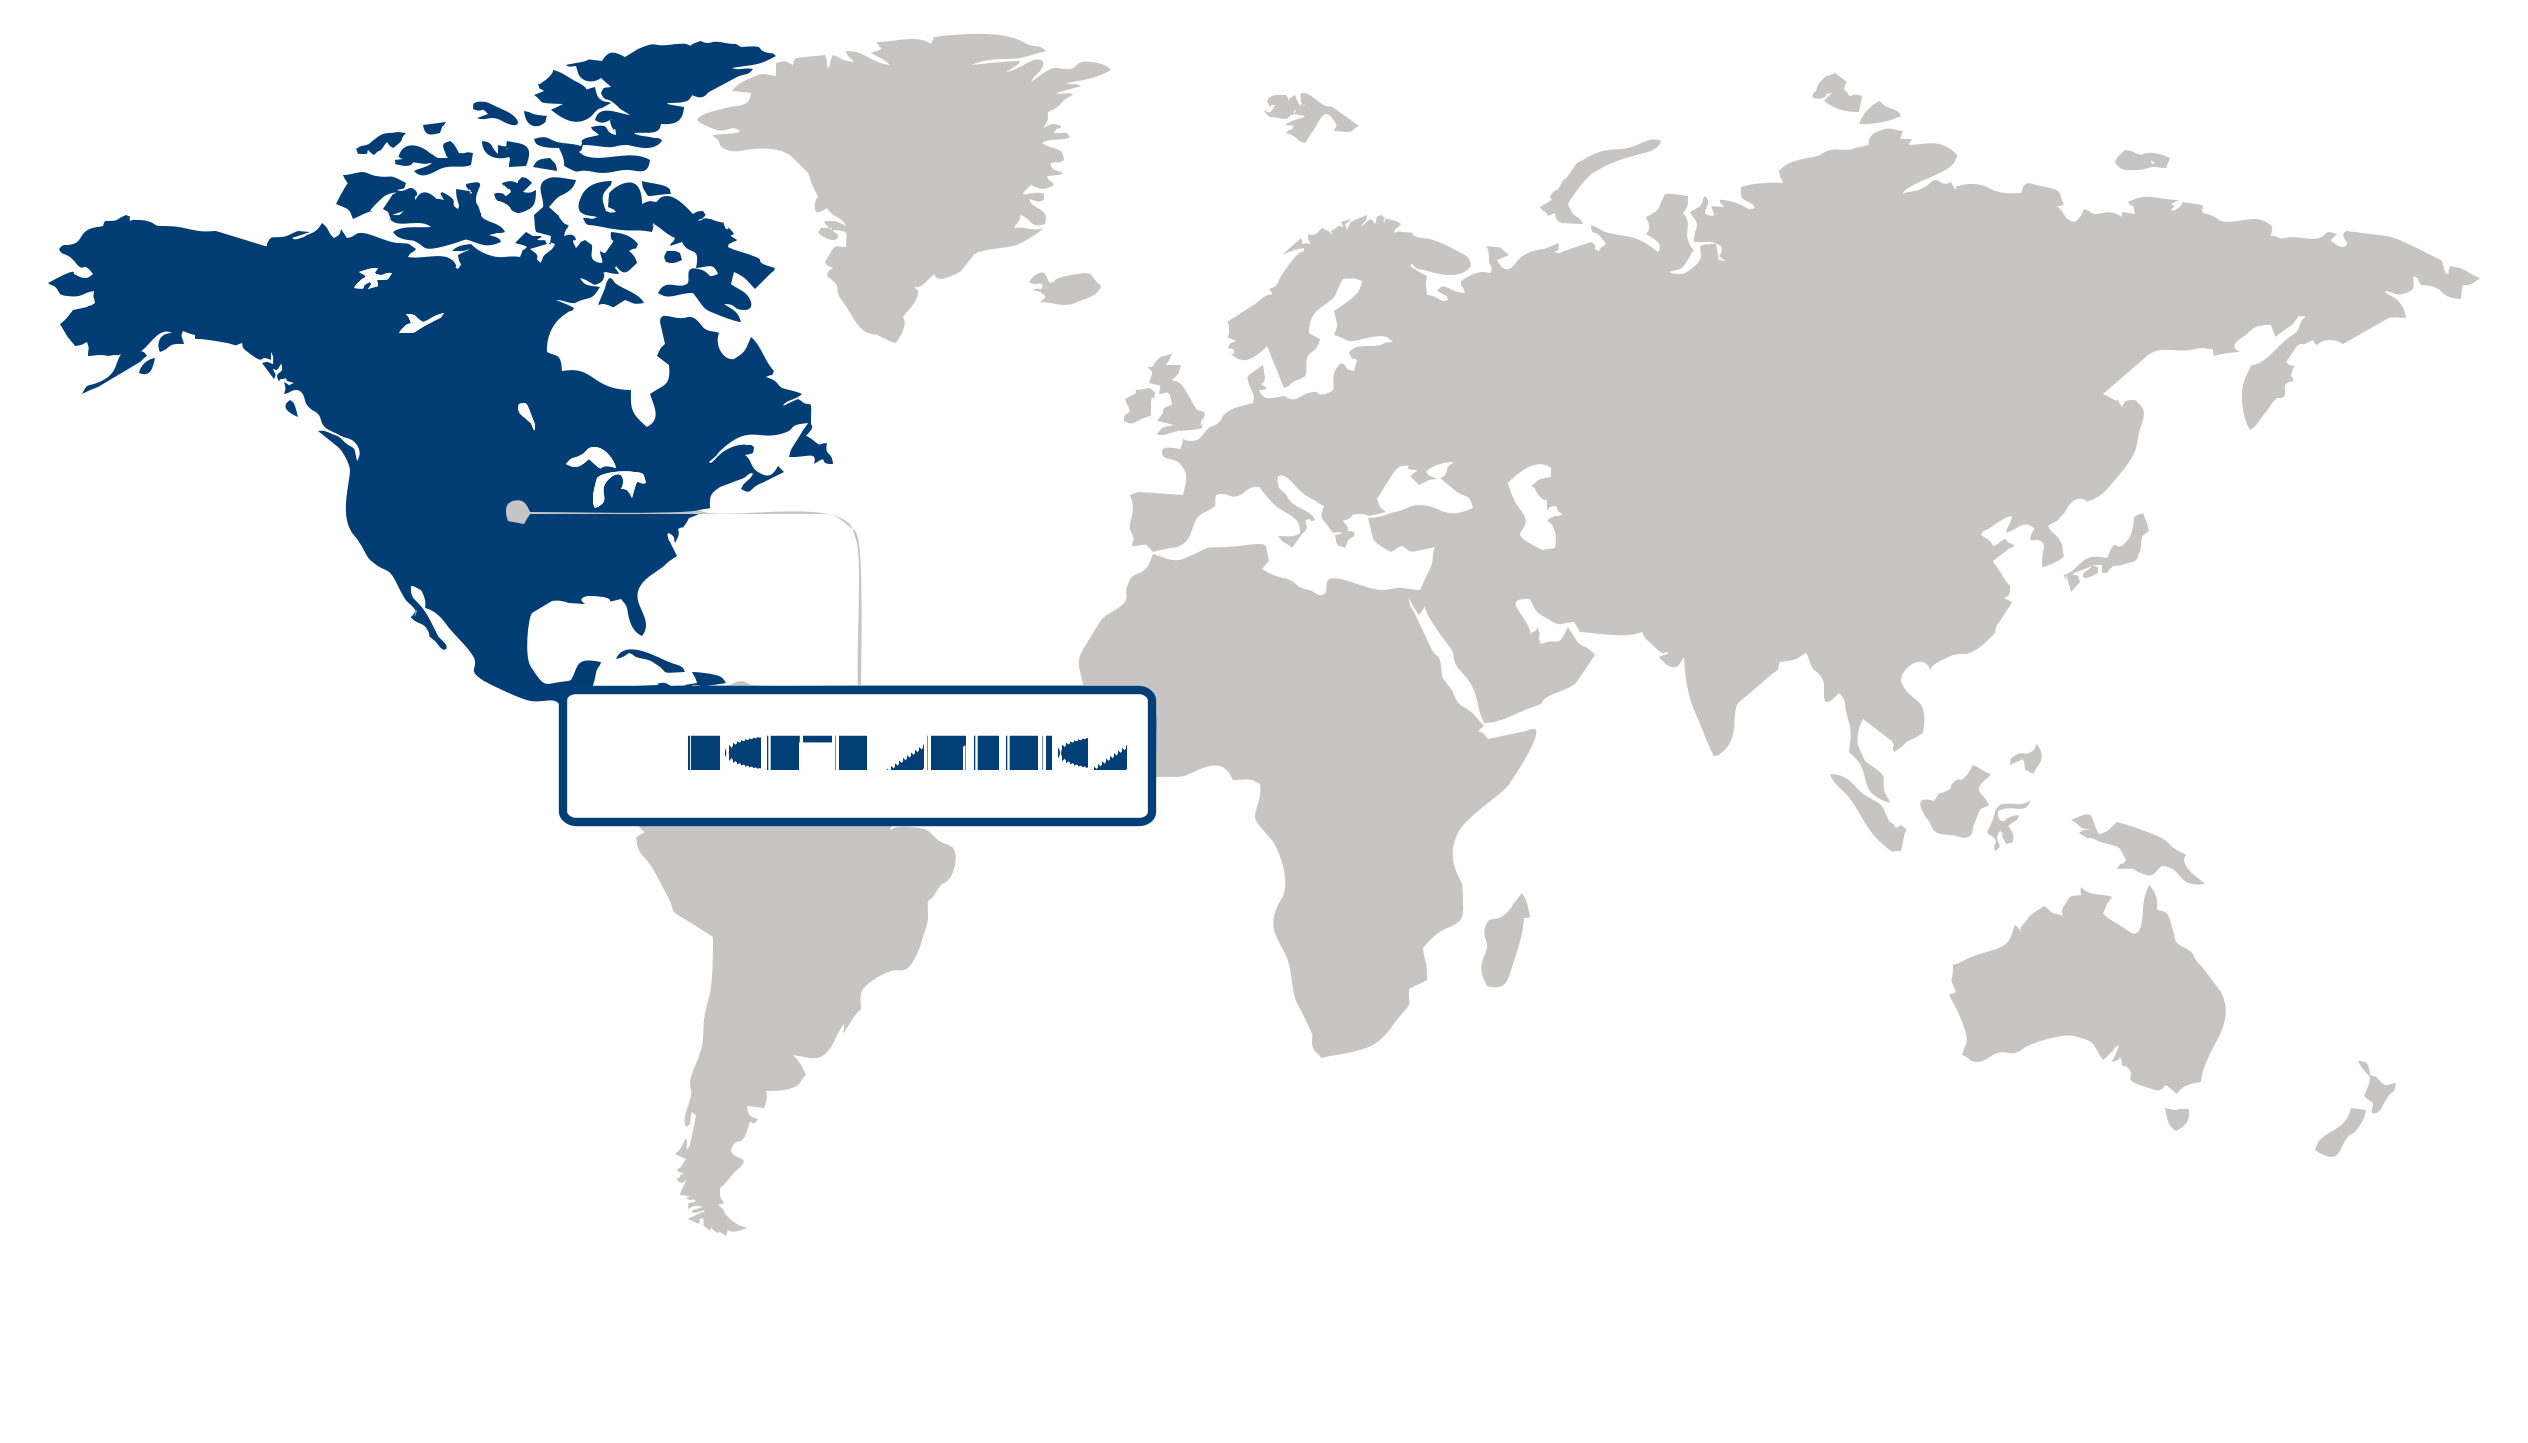
North America (Largest Region)
North America led the augmented analytics market with a 43.67% share in 2026, reflecting widespread adoption of advanced analytics, artificial intelligence, and machine learning across enterprises. Organizations in the region are increasingly using augmented analytics to automate data preparation, accelerate insight generation, and support faster decision-making without relying entirely on specialized data science teams. Strong cloud infrastructure, mature enterprise software adoption, and growing emphasis on data-driven business strategies are supporting market penetration across sectors such as finance, healthcare, retail, and manufacturing. The increasing integration of natural language interfaces and automated analytical capabilities into business intelligence environments is further enhancing the value of augmented analytics for organizations seeking greater efficiency and accessibility from their data.
Asia Pacific (Fastest-Growing Region)
Asia Pacific is emerging as the fastest-growing region in the augmented analytics market, supported by accelerating digitalization, expanding cloud adoption, and increasing investment in data-driven enterprise transformation. Businesses across the region are seeking automated analytical tools to manage growing volumes of operational and customer data while improving the speed and quality of business decisions. The expansion of digital commerce, financial technology, manufacturing modernization, and connected business ecosystems is creating additional demand for accessible analytics capabilities. Growing awareness of AI-enabled decision support and the need to improve productivity through automation are expected to encourage broader adoption of augmented analytics across both established enterprises and rapidly digitizing organizations.
| Parameter | North America | Asia Pacific | Europe | Latin America | MEA |
|---|---|---|---|---|---|
| Innovation Hub i Scale Nascent Developing Advanced | |||||
| Cost-Sensitive Region i Scale Low Medium High | |||||
| Regulatory Environment i Scale Restrictive Neutral Supportive | |||||
| Demand Drivers i Scale Weak Moderate Strong | |||||
| Development Stage i Scale Emerging Developing Developed | |||||
| Adoption Rate i Scale Low Medium High | |||||
| New Entrants/Startups i Scale Low Medium High | |||||
| Macro Indicators i Scale Weak Stable Strong |
Key Country Insights
Germany 🇩🇪
Operational Analytics OptimizationGermany prioritizes augmented analytics for industrial operations, supply chain management, and enterprise performance improvement. Organizations increasingly deploy AI-assisted analytics solutions that simplify data interpretation while supporting efficient and evidence-based business decisions.
France 🇫🇷
Collaborative Data IntelligenceFrance is adopting augmented analytics to improve collaboration between technical and business teams through accessible data visualization and automated insight generation. Enterprises increasingly seek platforms that enhance analytical consistency while supporting governance and regulatory expectations.
Italy 🇮🇹
Business Process AnalyticsItaly is integrating augmented analytics into enterprise operations to strengthen financial analysis, customer management, and operational planning. Companies increasingly value AI-supported analytics tools that improve reporting efficiency and broaden data-driven decision-making across business functions.
Japan 🇯🇵
Intelligent Business InsightsJapan is strengthening adoption of augmented analytics to improve enterprise productivity through automated reporting and predictive data interpretation. Businesses focus on user-friendly analytics platforms that enable wider access to actionable insights across operational functions.
South Korea 🇰🇷
AI Analytics AccelerationSouth Korea continues investing in augmented analytics to support digital enterprises seeking faster and more accessible business intelligence. Organizations emphasize AI-powered platforms that reduce manual analysis while improving responsiveness to changing business requirements.
United States 🇺🇸
Enterprise Decision IntelligenceThe U.S. continues expanding augmented analytics to help organizations automate data preparation, generate business insights, and improve decision-making. Enterprises increasingly integrate AI-enabled analytics platforms that support faster interpretation of complex operational and customer data.
Segment Leadership and Growth Trends
Augmented Analytics Market Share (%), by Component, 2026
Go beyond the chart, access full insights & data tables
Request Free Sample ReportComponent Segment Analysis: Software (Largest Segment) vs Services (Fastest-Growing Segment)
Software dominated the augmented analytics market, accounting for a 76.48% share in 2026. Its leading position is supported by the increasing integration of artificial intelligence, machine learning, automated data discovery, and natural language capabilities into enterprise analytics platforms. Software solutions enable organizations to process complex datasets, generate actionable insights, and support faster decision-making while reducing reliance on highly specialized analytics personnel. Their ability to integrate with existing business intelligence and data environments further strengthens adoption across functions such as finance, marketing, sales, and operations.
Services represent the fastest-growing component as organizations increasingly require specialized expertise to deploy, customize, integrate, and maintain augmented analytics environments. Enterprises often need implementation support to connect disparate data sources, configure analytical workflows, train users, and align analytics capabilities with specific business objectives. As analytics adoption expands beyond specialist teams and becomes more deeply embedded in operational processes, demand for consulting, integration, and managed services is gaining momentum.
Enterprise Size Segment Analysis: Large Enterprises (Largest Segment) vs Small & Medium-sized Enterprises (SMEs) (Fastest-Growing Segment)
Large enterprises held the largest share of the augmented analytics market at 71.52% in 2026. Their strong presence reflects greater investments in digital infrastructure, extensive data availability, and established analytics capabilities across multiple business functions. Large organizations also face complex decision-making requirements across geographically distributed operations, making automated insight generation and advanced data interpretation particularly valuable. The integration of augmented analytics into existing enterprise technology environments further supports its use for operational optimization, customer intelligence, financial planning, and strategic decision-making.
Small & medium-sized enterprises (SMEs) are emerging as the fastest-growing enterprise size segment as analytics technologies become more accessible and easier to deploy. Simplified interfaces, automation, cloud-based delivery, and lower implementation complexity are enabling smaller organizations to adopt capabilities that previously required substantial technical resources. Increasing digitalization among SMEs and their growing focus on improving customer understanding, operational efficiency, and data-driven planning are supporting broader adoption of augmented analytics.
| Segment | Sub-Segment | Largest Segment | Fastest Growing |
|---|---|---|---|
| Component | Software, Services | Software | Services |
| Enterprise Size | Small & Medium-sized Enterprises (SMEs), Large Enterprises | Large Enterprises | Small & Medium-sized Enterprises (SMEs) |
| Deployment Type | Cloud, On-premise | Cloud | On-premise |
| Vertical | Retail & E-commerce, Healthcare, BFSI, IT & Telecommunication, Manufacturing, Government, Energy Utilities, Others | BFSI | Retail & E-commerce |
Competitive Landscape and Market Positioning
Prominent players in the augmented analytics market:
1. Microsoft Corporation (United States)
2. International Business Machines Corporation (United States)
3. Oracle Corporation (United States)
4. SAP SE (Germany)
5. Salesforce Inc. (United States)
6. QlikTech International AB (United States)
7. SAS Institute Inc. (United States)
8. MicroStrategy Incorporated (United States)
9. ThoughtSpot Inc. (United States)
10. Sisense Ltd. (United States)
As basic business intelligence tools become commoditized, software architects are executing distinct product strategies to stand out in the augmented analytics market. Instead of offering standard static metric dashboards, leading platforms are carving out specialized niches by embedding automated, natural-language query generation and conversational insight engines directly into workflows. This technical isolation appeals directly to decentralized corporate departments, enabling non-technical personnel to surface predictive trends and multi-variable anomalies without relying on data science teams.
| Company | Market Share | Company Revenue | Revenue CAGR (%) | Product Portfolio | Geographic Presence | Innovation / R&D Focus | Strategic Developments |
|---|---|---|---|---|---|---|---|
| Microsoft Corporation (United States) | |||||||
| International Business Machines Corporation (United States) | |||||||
| Oracle Corporation (United States) | |||||||
| SAP SE (Germany) | |||||||
| Salesforce Inc. (United States) | |||||||
| QlikTech International AB (United States) | |||||||
| SAS Institute Inc. (United States) | |||||||
| MicroStrategy Incorporated (United States) | |||||||
| ThoughtSpot Inc. (United States) | |||||||
| Sisense Ltd. (United States). |
Industry Development/News
| Company Name | Date | Key Development |
|---|---|---|
| ThoughtSpot | Feb-26 | ThoughtSpot expanded its agentic analytics portfolio by launching "Spotter," an AI agent for data exploration, alongside the Analyst Studio. These tools automate data preparation and optimize query costs via SpotCache, reflecting a broader industry shift toward autonomous, multi-step analytical pipelines that chain detection, investigation, and narrative generation without human direction. |
| Databricks | Jan-26 | Databricks integrated "AI/BI Genie" and "Mosaic AI" into its unified data intelligence platform to provide governed, natural language-driven analytics. By utilizing Unity Catalog for schema governance, the platform enables non-technical users to perform complex data queries and automated insight generation, effectively lowering the barrier to entry for advanced, AI-powered business intelligence. |
| Snowflake | Jan-26 | Snowflake expanded its Cortex AI suite with new LLM-powered functions, including "Analyst" and "Document AI," built natively into its data cloud. These advancements enable enterprises to automate unstructured data processing and integrate predictive modeling directly into SQL workflows, supporting a strategic transition toward autonomous, prescriptive analytics for large-scale enterprise environments. |
| GoodData | Sep-25 | GoodData acquired Understand Labs to integrate advanced agentic analytics and data storytelling capabilities into its AI-native platform. This acquisition enhances the company's ability to deliver explainable, human-centered insights and strengthens its competitive position in providing enterprise-grade augmented analytics that automate complex data exploration and interpretation. |
| Nov-24 | Google enhanced its Looker platform by integrating advanced agentic AI capabilities designed to automate complex analytical tasks. By enabling autonomous data exploration and multi-step investigation workflows, this update significantly improves the platform’s augmented analytics functionality, allowing business users to derive deeper insights with reduced manual effort. |
Customize Your Report
Explore examples of how this report can be tailored to different research needs, including custom segments, additional topics or chapters, and related reports. Click a section of the wheel or its numbered marker to explore the available options.
Augmented Analytics Market — Custom Segments
| Segment | Sub-Segment |
|---|---|
| Decision-Making Function | Strategic Planning, Financial Decision-Making, Sales & Marketing, Operations & Supply Chain, Risk & Compliance |
| Data Source Type | Structured Enterprise Data, Unstructured Content Data, Real-Time & Streaming Data, External & Third-Party Data |
| Analytics Maturity | Descriptive & Diagnostic Analytics, Predictive Analytics, Prescriptive Analytics, Autonomous Analytics |
Augmented Analytics Market — Custom TOC
| Custom Chapter | Custom Details |
|---|---|
| Enterprise Decision Intelligence Readiness |
|
| Analytics Workflow Automation Strategy |
|
| Data and AI Platform Ecosystem |
|
Need a different cut of the data?
Request Custom ResearchWhat is the market size of augmented analytics?
How is the augmented analytics industry expected to grow over the next 10 years?
Why are enterprises increasingly adopting augmented analytics platforms for business decision-making?
How are AI, ML, and NLP technologies expanding adoption in the augmented analytics market?
Why does software dominate the augmented analytics market?
Why are SMEs the fastest-growing enterprise segment in the augmented analytics market?
Why does North America hold the largest share in augmented analytics?
What is driving Asia Pacific’s fastest growth in augmented analytics?
Which organizations are considered leaders in the augmented analytics landscape?
Our Clients
"The team demonstrated a great understanding of our business needs, and the reports were tailored to address our specific concerns and objectives."
Infosys
"The report was up-to-date with the latest industry trends and technological advancements. The detailed competitive landscape analysis was quite helpful."
Zebra Technologies
"The data presented in the report was accurate and well-researched. I also found the market dynamics section particularly useful."
Arlo Technologies
Our Research Team & Methodology
Every Fundamental Business Insights report is built by a dedicated vertical research team, validated through a structured primary-and-secondary methodology, and reviewed for accuracy before it reaches you.
Research Team Overview
Prepared by the Smart Technologies Research Team
Delivery
Published
Demand
Available
Support
Trust & Compliance
Research Domains
10 coverage areasResearch Intelligence
| Source | Reference |
|---|---|
| National Institute of Standards and Technology (NIST) | www.nist.gov |
| International Organization for Standardization (ISO) | www.iso.org |
| Institute of Electrical and Electronics Engineers (IEEE) | www.ieee.org |
| Internet Engineering Task Force (IETF) | www.ietf.org |
| World Wide Web Consortium (W3C) | www.w3.org |
| Cloud Security Alliance (CSA) | cloudsecurityalliance.org |
| Open Source Initiative (OSI) | opensource.org |
| Linux Foundation | www.linuxfoundation.org |
| FinOps Foundation | www.finops.org |
| PCI Security Standards Council | www.pcisecuritystandards.org |
| SWIFT | www.swift.com |
| Financial Stability Board (FSB) | www.fsb.org |
| GSMA | www.gsma.com |
| International Telecommunication Union (ITU) | www.itu.int |
| OWASP Foundation | owasp.org |
| MITRE | www.mitre.org |
| World Economic Forum (WEF) | www.weforum.org |
| OECD Digital Economy | www.oecd.org/digital |
| World Bank Data | data.worldbank.org |
| U.S. Census Bureau | www.census.gov |
Research Workflow & Quality Assurance
Data Collection
Verified information gathered through primary and secondary research.
Data Triangulation
Cross-validation using multiple independent data sources.
Forecast Modelling
Market estimates developed using historical trends and analytical models.
Analyst Validation
Findings reviewed by domain experts for accuracy and consistency.
Editorial & Quality Review
Final editorial, quality, and compliance checks before publication.
Final Publication
Released after successful completion of the internal review process.
Report Coverage
📊 Market Assessment
- Market Size & Forecast
- Market Segmentation
- Regional Analysis
- Growth Drivers & Challenges
- Market Dynamics
🏢 Competitive Intelligence
- Competitive Landscape
- Company Profiles
- Competitive Benchmarking
- Mergers & Acquisitions
- Market Share Analysis or Key Company Strategies
🔍 Strategic Analysis
- Value Chain Analysis
- Porter's Five Forces
- PESTLE Analysis
- Pricing Trends
- Supply-Demand Analysis
🚀 Future Outlook
- Technology Landscape
- Regulatory Landscape
- Investment & Funding Landscape
- Emerging Opportunities
- Future Market Outlook
Have a question about this report or need a custom scope?
Request Customization