Energy ESO Market Size & Growth Forecast 2027–2036, By Segments (Location, Energy Source, Service), Regional Demand Trends (North America, Asia Pacific, Europe), Key Country Insights (U.S., Japan, South Korea, Germany, France, Italy), and Competitive Landscape
Jump to content
Market Size and Growth Outlook
Energy ESO Market size stood at USD 642.8 million in 2026 and is predicted to grow at a 18.34% CAGR from 2027 to 2036, reaching USD 3.46 billion by 2036. The industry revenue for 2027 is assessed at USD 742.05 million.
Get more details on this report
Request Free Sample ReportEnergy ESO Market Intelligence Snapshot
Regional Market Dynamics
- Asia Pacific leads with 39.22% share due to large electricity demand expanding grid infrastructure and reliance on optimization tools for load balancing and dispatch efficiency across complex networks.
- Europe grows at 21.62% CAGR driven by renewable integration, cross-border power flows, and rising need for advanced software-led grid balancing and system orchestration.
Segment Momentum
- Non-renewable held a 54.81% share in 2026 due to its established integration within existing grids and energy supply systems, supporting consistent dispatch, asset utilization, and familiar operating models.
- Offshore is growing fastest as developers seek new capacity in areas where land constraints, permitting challenges, or infrastructure limitations restrict onshore expansion, creating more opportunities for large-scale project development.
Market Expansion Drivers
- Increasing digitization of energy infrastructure driving outsourcing demand for engineering service providers.
- Growing adoption of smart grid and IoT-based energy management solutions accelerating engineering partnerships.
- Rising renewable energy infrastructure investments increasing demand for virtual prototyping and testing services.
Leading Market Participants
- Key players in the energy ESO market include Worley Limited (Australia), Wood Group (John Wood Group PLC) (United Kingdom), Jacobs Solutions Inc. (United States), Fluor Corporation (United States), Technip Energies N.V. (France), AtkinsRéalis (Canada), QuEST Global Services Pte. Ltd. (Singapore), Capgemini Engineering (France), Cyient Limited (India), Alten S.A. (France).
Global Market Forecast Snapshot
Market Outlook
- 2026 Market Size: USD 642.8 million
- 2027 Estimated Market Size: USD 742.05 million.
- Projected Market Size: USD 3.46 billion by 2036
- Growth Forecast: 18.34% CAGR (2027-2036)
Regional and Segment Outlook
- Leading Regional Market: Asia Pacific
- High-Growth Regional Hub: Europe
- Core Revenue Segment: Onshore (Location) | Non-renewable (Energy Source) | Structuring & Layout (Service)
- Emerging Opportunity Segment: Offshore (Location) | Renewable (Energy Source) | Digitization (Service)
Market Growth Drivers and Industry Trends
Increasing digitization of energy infrastructure driving outsourcing demand for engineering service providers
Digital transformation across energy infrastructure is increasing the complexity of engineering, design, simulation, and system management activities, encouraging energy organizations to rely on specialized external capabilities. The energy ESO market is consequently supported by growing requirements for engineering expertise that can help utilities and energy operators modernize legacy infrastructure, manage digital workflows, and integrate advanced technologies into existing systems. Outsourcing also enables organizations to access specialized technical resources without building every engineering capability internally, particularly as projects require multidisciplinary expertise spanning electrical systems, software-enabled infrastructure, automation, and digital engineering.
Growing adoption of smart grid and IoT-based energy management solutions accelerating engineering partnerships
The transition toward smart grids and connected energy management is creating greater demand for engineering support throughout system design, integration, testing, and optimization. Growth in the energy ESO market is closely linked to the need for specialized partners capable of developing engineering solutions around connected devices, grid monitoring, automated controls, and data-enabled energy operations. IoT-based infrastructure introduces additional requirements for interoperability and system coordination, while smart grid deployments require engineering approaches that can accommodate distributed assets, real-time information flows, and increasingly sophisticated energy management architectures.
Rising renewable energy infrastructure investments increasing demand for virtual prototyping and testing services
Increasing investment in renewable energy projects is expanding the need for engineering services that can address complex system configurations before physical deployment. The energy ESO market can benefit from greater use of virtual prototyping, simulation, and testing to evaluate equipment performance, optimize designs, identify potential integration issues, and support engineering validation across renewable energy infrastructure. These digital engineering approaches can help project developers and equipment stakeholders assess system behavior across different operating conditions while reducing reliance on repeated physical development during the design and testing process.
| Growth Driver | Impact on CAGR | Regulatory Influence | Geographic Relevance | Adoption Rate | Impact Timeline |
|---|---|---|---|---|---|
| Increasing digitization of energy infrastructure driving outsourcing demand for engineering service providers | 2.00% | Moderate | North America, Europe, Asia Pacific | High | Near Term |
| Growing adoption of smart grid and IoT-based energy management solutions accelerating engineering partnerships | 1.80% | Moderate | Europe, Asia Pacific | High | Mid Term |
| Rising renewable energy infrastructure investments increasing demand for virtual prototyping and testing services | 1.50% | Moderate | North America, Europe | Emerging | Long Term |
Unlock insights tailored to your business with our bespoke market research solutions.
Click to get your customized report now.
Regional Demand Dynamics
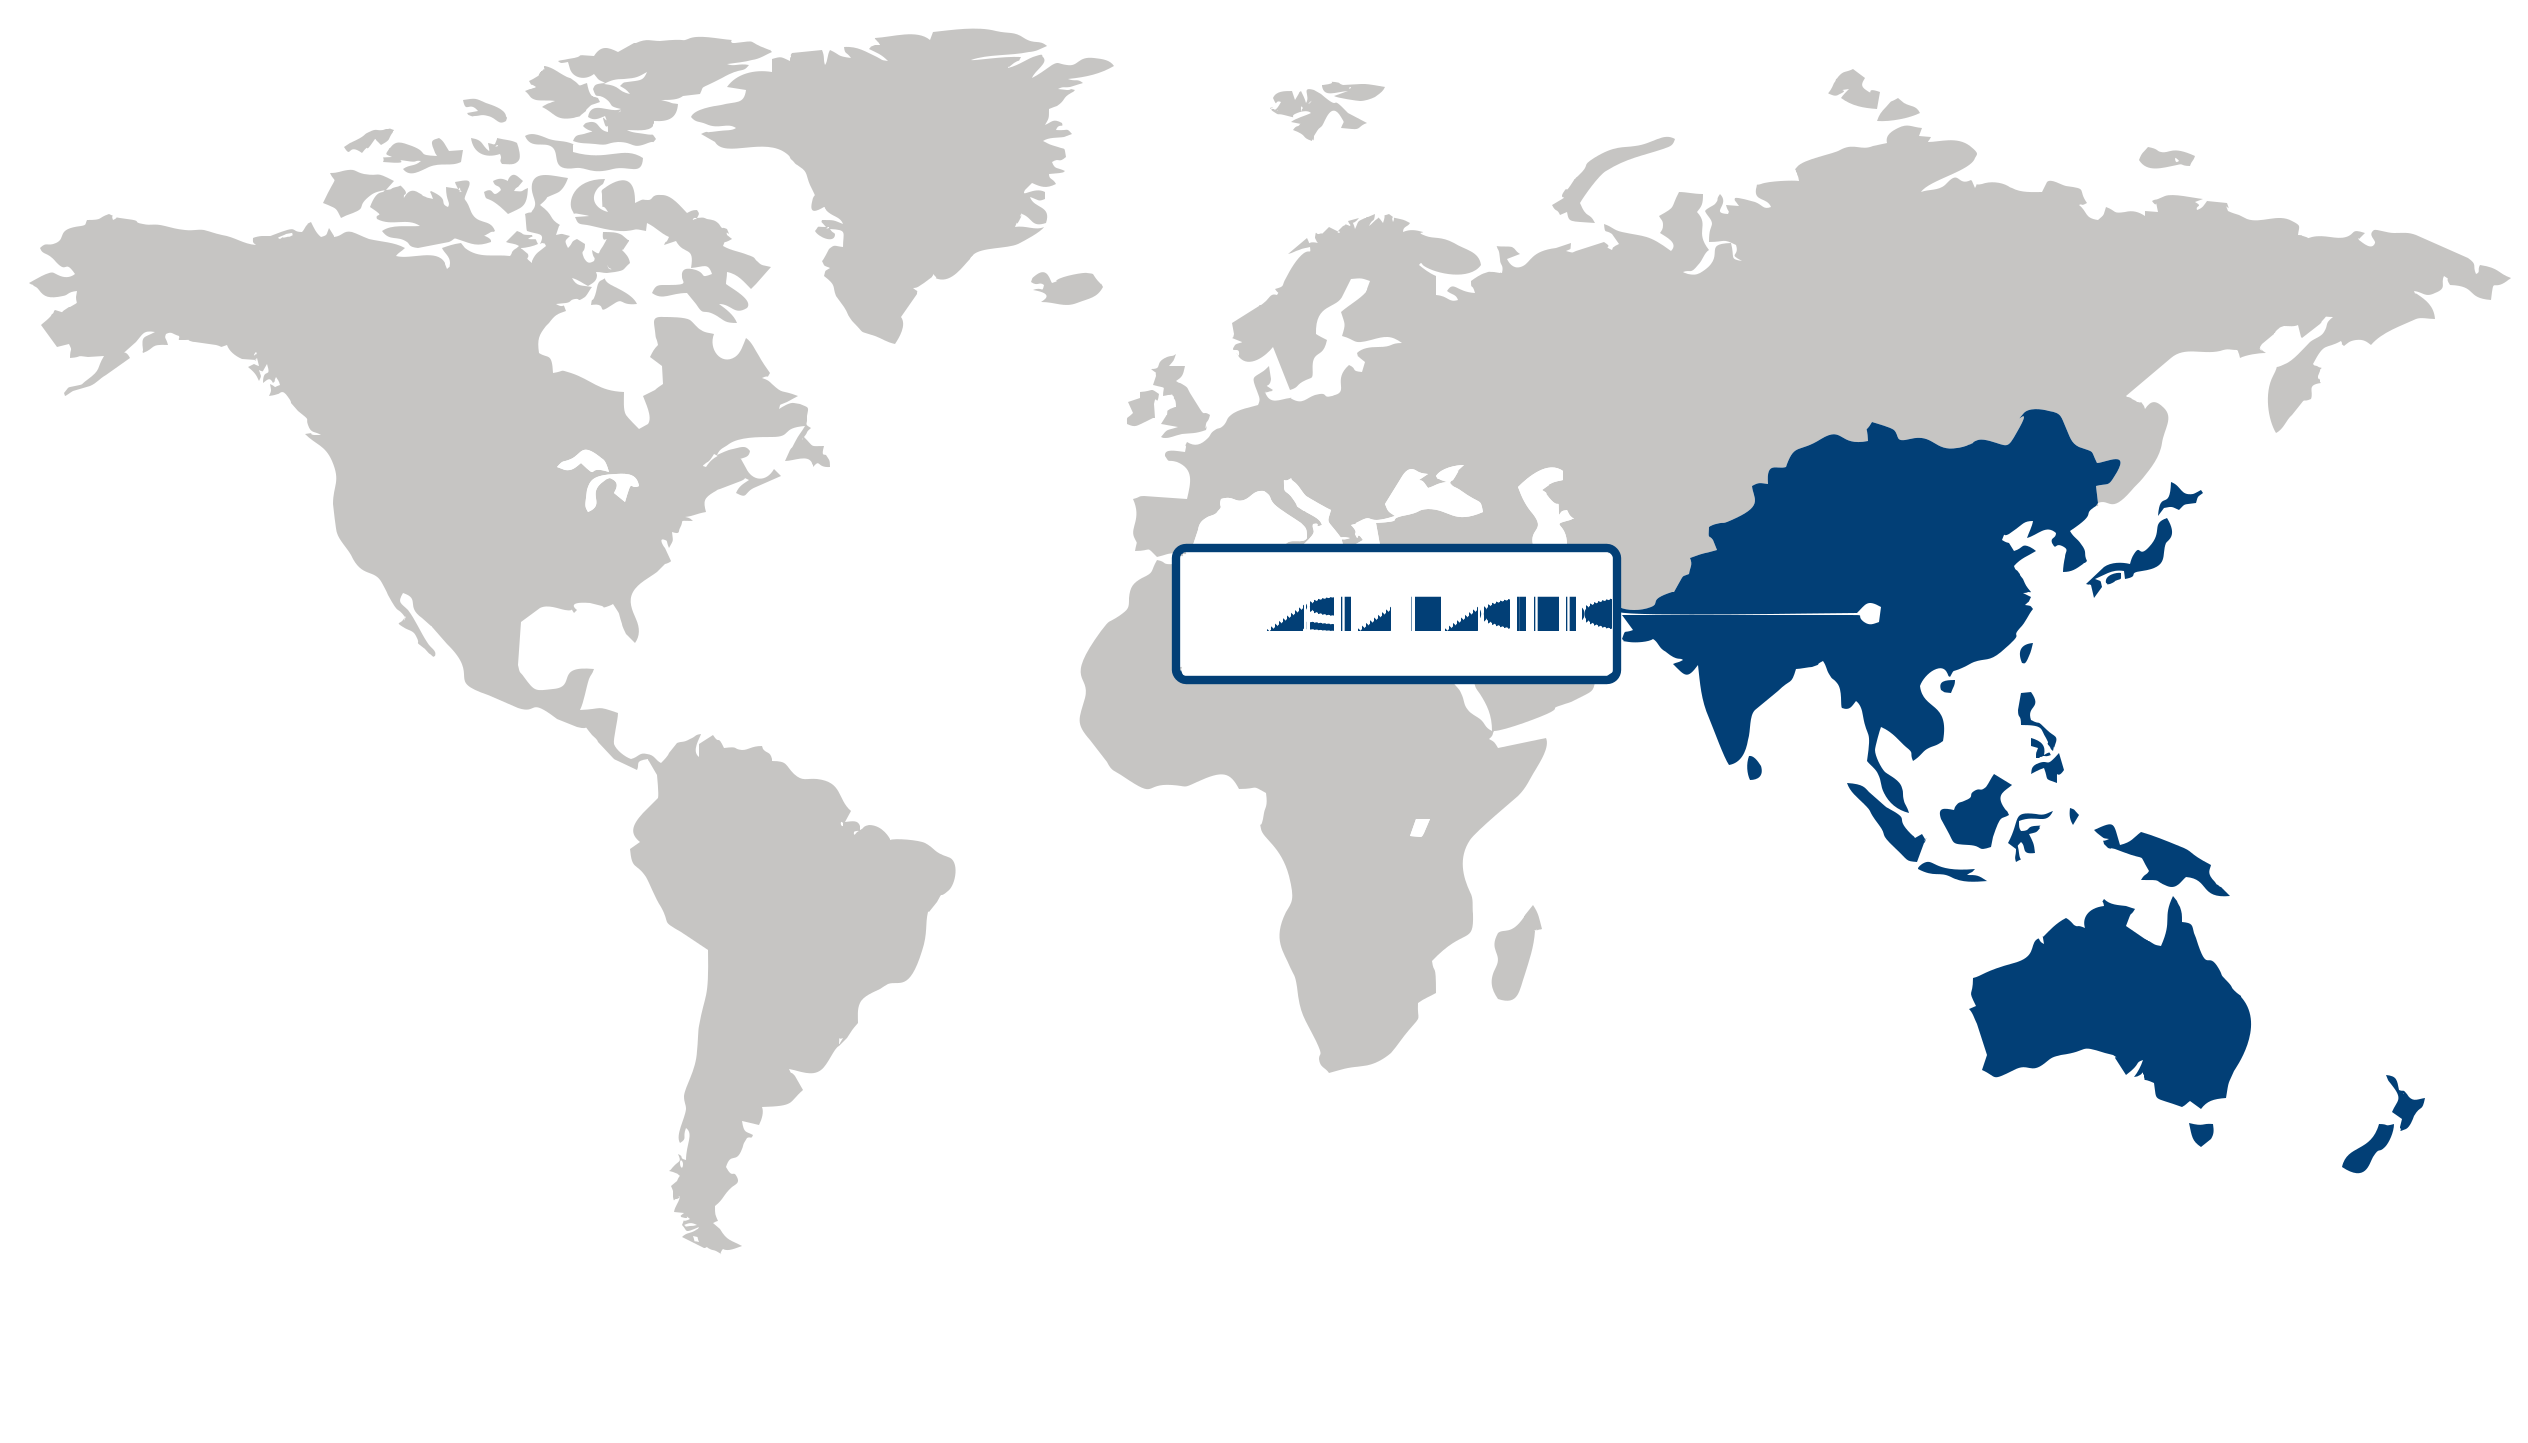
Asia Pacific (Largest Region)
In the energy ESO market, Asia Pacific accounted for the largest share of 39.22% in 2026. The region's leading position is supported by expanding energy infrastructure, rising electricity demand, and the increasing complexity of power systems associated with industrialization and urban development. Energy service outsourcing is gaining relevance as utilities and energy-intensive organizations seek specialized capabilities for asset management, engineering, maintenance, digitalization, and operational efficiency. The transition toward cleaner energy sources is also creating greater demand for technical expertise in integrating renewable generation, modernizing grids, and improving system reliability. Strong infrastructure investment and the need to manage increasingly sophisticated energy networks are therefore sustaining the region's prominent market position.
Europe (Fastest-Growing Region)
Europe is emerging as the fastest-growing region, driven by the accelerating transition toward low-carbon energy systems and greater emphasis on grid modernization. Regulatory and policy priorities around decarbonization, energy efficiency, and renewable integration are encouraging utilities and energy organizations to adopt specialized external services. The growing complexity of balancing intermittent renewable generation with grid stability is increasing demand for engineering, digital, and operational expertise. In addition, investments in smart-grid technologies, energy storage integration, and infrastructure upgrades are creating additional opportunities for energy ESO providers. Europe's focus on improving energy resilience while progressing toward a more sustainable power system is expected to maintain strong momentum for market expansion.
| Parameter | North America | Asia Pacific | Europe | Latin America | MEA |
|---|---|---|---|---|---|
| Innovation HubiScaleNascentDeveloping Advanced | |||||
| Cost-Sensitive RegioniScaleLowMedium High | |||||
| Regulatory EnvironmentiScaleRestrictiveNeutral Supportive | |||||
| Demand DriversiScaleWeakModerate Strong | |||||
| Development StageiScaleEmergingDeveloping Developed | |||||
| Adoption RateiScaleLowMedium High | |||||
| New Entrants / StartupsiScaleSparseModerate Dense | |||||
| Macro IndicatorsiScaleWeakStable Strong |
Key Country Insights
Germany 🇩🇪
Renewable Operations SupportGermany prioritizes energy ESO services that manage increasingly complex renewable energy assets and distributed power infrastructure. German utilities seek operational partners capable of improving system reliability, asset utilization, and compliance with evolving energy transition requirements.
France 🇫🇷
Decarbonization Operations SupportFrance leverages energy ESO services to improve operational efficiency across renewable generation, transmission assets, and energy distribution networks. The French market values integrated operational expertise that supports sustainable infrastructure management and optimized energy performance.
Italy 🇮🇹
Utility Efficiency EnhancementItaly increasingly adopts energy ESO services to streamline utility operations and improve the performance of electricity networks. Italian energy organizations focus on digital asset management, operational continuity, and efficient maintenance strategies across evolving energy systems.
Japan 🇯🇵
Utility Modernization FocusJapan applies energy ESO services to modernize utility operations, strengthen grid resilience, and optimize aging infrastructure. Organizations in Japan increasingly value digital operational platforms that improve maintenance planning and efficient network management.
South Korea 🇰🇷
Digital Energy ManagementSouth Korea expands energy ESO adoption through smart grid initiatives, industrial energy optimization, and advanced monitoring platforms. Energy providers in South Korea prioritize service partners capable of supporting data-driven operations and efficient infrastructure management.
United States 🇺🇸
Grid Optimization ServicesThe U.S. energy ESO market emphasizes outsourcing operational expertise to improve grid efficiency, renewable integration, and asset performance. Utilities across the U.S. increasingly adopt digital monitoring, predictive maintenance, and analytics to strengthen energy system operations.
Energy ESO Market Share (%), by Location, 2026
Go beyond the chart, access full insights & data tables
Request Free Sample ReportLocation Segment Analysis: Onshore (Largest Segment) vs Offshore (Fastest-Growing Segment)
The onshore segment held the largest share of the energy ESO market, accounting for 59.75% in 2026, supported by the extensive engineering, design, maintenance, and operational requirements associated with land-based energy infrastructure. Onshore projects generally involve established development environments and require engineering services across asset design, equipment integration, optimization, and lifecycle management. Continued efforts to improve operational efficiency, modernize energy infrastructure, and manage complex technical requirements are sustaining demand for engineering service outsourcing across onshore applications.
The offshore segment is the fastest-growing location category, driven by the increasing technical complexity of offshore energy projects and the need for specialized engineering capabilities. Offshore assets require advanced design, monitoring, maintenance, and reliability solutions to address demanding operating environments and logistical constraints. Greater emphasis on asset performance, remote engineering support, and technology-enabled project management is encouraging broader use of outsourced engineering services in offshore energy operations.
Energy Source Segment Analysis: Non-renewable (Largest Segment) vs Renewable (Fastest-Growing Segment)
In the energy ESO market, the non-renewable segment represented the largest energy source category, with a 54.81% share in 2026, reflecting the extensive engineering requirements associated with established conventional energy infrastructure. These assets require ongoing technical support for design improvements, maintenance, process optimization, safety, and operational reliability. The complexity of existing facilities and the need to extend asset performance continue to generate demand for specialized engineering outsourcing capabilities.
The renewable segment is advancing at the fastest pace as energy systems increasingly incorporate cleaner generation technologies and require new engineering expertise. Renewable projects create demand for services spanning system design, integration, performance optimization, digital monitoring, and infrastructure development. The broader transition toward more sustainable energy systems is encouraging investment in technical capabilities that can support the deployment and efficient operation of renewable assets.
| Segment | Sub-Segment | Largest Segment | Fastest Growing |
|---|---|---|---|
| Location | Onshore, Offshore | Onshore | Offshore |
| Energy Source | Renewable, Non-renewable, Chemical Processing | Non-renewable | Renewable |
| Service | R&D and Designing, Structuring & Layout, Digitization, Implementation & Maintenance | Structuring & Layout | Digitization |
Competitive Landscape and Market Positioning
Top players in the energy ESO market:
1. Worley Limited (Australia)
2. Wood Group (John Wood Group PLC) (United Kingdom)
3. Jacobs Solutions Inc. (United States)
4. Fluor Corporation (United States)
5. Technip Energies N.V. (France)
6. AtkinsRéalis (Canada)
7. QuEST Global Services Pte. Ltd. (Singapore)
8. Capgemini Engineering (France)
9. Cyient Limited (India)
10. Alten S.A. (France)
The energy ESO market is being shaped by rising investments in smart grid infrastructure and intelligent energy management systems. Companies are focusing on improving grid flexibility, operational reliability, and renewable energy integration through advanced digital solutions. Ongoing development of efficient energy optimization technologies is also contributing to stronger market differentiation.
| Company | Market Share | Company Revenue | Revenue CAGR (%) | Product Portfolio | Geographic Presence | Innovation / R&D Focus | Strategic Developments |
|---|---|---|---|---|---|---|---|
| Worley Limited (Australia) | |||||||
| Wood Group (John Wood Group PLC) (United Kingdom) | |||||||
| Jacobs Solutions Inc. (United States) | |||||||
| Fluor Corporation (United States) | |||||||
| Technip Energies N.V. (France) | |||||||
| AtkinsRéalis (Canada) | |||||||
| QuEST Global Services Pte. Ltd. (Singapore) | |||||||
| Capgemini Engineering (France) | |||||||
| Cyient Limited (India) | |||||||
| Alten S.A. (France). |
Industry Development / News
| Company Name | Date | Key Development |
|---|---|---|
| AtkinsRéalis | Mar-25 | AtkinsRéalis secured an Architecture & Engineering contract with LUMA Energy ServCo to reinforce Puerto Rico’s transmission and distribution network. The specialized engineering services agreement centers on designing and implementing hurricane-resilient structural enhancements across the regional electrical infrastructure. |
| Hitachi Energy | Mar-25 | Hitachi Energy committed USD 250 million to expand its global transformer manufacturing facilities. The industrial capacity expansion is designed to mitigate supply chain shortages and meet the surging grid infrastructure demands driven by data-center and AI infrastructure power needs. |
| AFRY | Feb-25 | AFRY was appointed as the principal engineering services partner for SSAB’s fossil-free steel plant project in Luleå, Sweden. This strategic industrial assignment leverages AFRY's energy engineering capabilities to drive operational decarbonization within large-scale steel manufacturing infrastructure. |
| ALTEN | Jan-25 | ALTEN finalized the acquisition of WORLDGRID from Atos in a transaction adding approximately EUR 170 million (USD 187 million) in annualized revenue. The acquisition expands ALTEN's engineering service portfolio within the energy and public utilities software solutions domain. |
| SolarEdge Technologies, Inc. | Feb-23 | SolarEdge Technologies, Inc. launched its inaugural battery virtual power plant in the UK to support the National Grid ESO Demand Flexibility Service. The initiative allows eligible home battery owners with smart meters to actively contribute to the national grid's operational resilience during peak demand periods. |
| Electricity System Operator (ESO) | Sep-22 | The Great Britain Electricity System Operator introduced a new connection management strategy to optimize its Transmission Entry Capacity register. By eliminating stalled energy projects from the register, the initiative accelerates network access and optimizes infrastructure capacity for active, higher-probability energy installations. |
| National Grid Electricity System Operator | Aug-22 | National Grid Electricity System Operator signed a multi-year software agreement with Energy Exemplar to deploy the PLEXOS unified energy market simulation platform. The engineering software enables advanced modeling of future energy scenarios to prioritize grid expansions for large-scale renewables and hydrogen integration. |
| GE Digital | Apr-22 | GE Digital deployed its innovative Effective Inertia Metering & Forecasting solution across the Great Britain power network operated by National Grid Electricity System Operator. This software system tracks real-time power grid inertia to maintain network stability amidst the growth of renewable energy sources. |
Customize Your Report
Explore examples of how this report can be tailored to different research needs, including custom segments, additional topics or chapters, and related reports. Click a section of the wheel or its numbered marker to explore the available options.
Energy ESO Market — Custom Segments
| Segment | Sub-Segment |
|---|---|
| End User Industry | Oil & Gas, Power & Utilities, Renewable Energy, Industrial Manufacturing, Chemicals & Petrochemicals |
| Asset Type | Power Generation Assets, Transmission & Distribution Assets, Oil & Gas Assets, Industrial Process Assets |
| Engagement Model | Project-Based Services, Managed Services, Dedicated Engineering Services, Build-Operate-Transfer |
Energy ESO Market — Custom TOC
| Custom Chapter | Chapter Details |
|---|---|
| Energy Transition Service Opportunity Mapping |
|
| Utility Outsourcing Maturity Benchmark |
|
| Digital Grid Services Adoption Outlook |
|
Need a different cut of the data?
Request Custom ResearchFrequently Asked Questions
What is the market valuation of energy ESO?
What is the forecasted size of the energy ESO industry?
How is energy infrastructure digitization influencing demand for engineering outsourcing services?
Why are smart grid deployments increasing long-term engineering partnerships in the energy ESO market?
Why does Non-renewable remain the largest energy source segment in the energy ESO market?
Why is Offshore the fastest-growing location segment in the energy ESO market?
Why does Asia Pacific lead the energy ESO market?
Why is Europe the fastest-growing region in the energy ESO market?
Which companies dominate the energy ESO landscape?
Our Clients
"The information presented in the report was genuinely insightful. The data was clear and easy to understand, which made it much easier to interpret the findings."
Amara Raja Group
"The responsiveness and professionalism exhibited by the team were exemplary. They were readily available to address queries, provide clarifications, and offer additional insights."
ONGC
"The reports offered a comprehensive analysis of various segments within the market. The detailed insights into market trends, and regulatory landscapes were excellent."
TotalEnergies
Our Research Team & Methodology
Every Fundamental Business Insights report is built by a dedicated vertical research team, validated through a structured primary-and-secondary methodology, and reviewed for accuracy before it reaches you.
Delivery
Published
Available
Support
- Market Size & Forecast
- Market Segmentation
- Regional Analysis
- Growth Drivers & Challenges
- Market Dynamics
- Competitive Landscape
- Company Profiles
- Competitive Benchmarking
- Mergers & Acquisitions
- Market Share Analysis or Key Company Strategies
- Value Chain Analysis
- Porter's Five Forces
- PESTLE Analysis
- Pricing Trends
- Supply-Demand Analysis
- Technology Landscape
- Regulatory Landscape
- Investment & Funding Landscape
- Emerging Opportunities
- Future Market Outlook