Fuel Card Market Size & Growth Forecast 2027–2036, By Segments (Technology, Type, Application), Regional Demand Trends (North America, Asia Pacific, Europe), Key Country Insights (U.S., Japan, South Korea, Germany, France, Italy), and Competitive Landscape
Market Size and Growth Outlook
Fuel Card Market size was over USD 960.7 billion in 2026 and is likely to grow at a 13.49% CAGR between 2027 and 2036, attaining USD 3.41 trillion by 2036. The industry revenue for 2027 is estimated at USD 1.07 trillion.
Get more details on this report
Request Free Sample ReportFuel Card Market Intelligence Snapshot
Regional Market Dynamics
- North America leads due to mature payment infrastructure, widespread fuel network acceptance, and established fleet management systems supporting commercial transportation demand.
- Asia Pacific is projected to grow at an 11.3% CAGR, driven by fleet formalization, fuel payment digitization, and increasing demand for centralized expense management.
Segment Momentum
- Smart Cards lead the market due to their ability to support stronger transaction security, reliable data capture, and tighter fleet expense controls, making them well suited for fleet management operations.
- Universal Fuel Cards are the fastest-growing type because they provide broader acceptance across fuel brands and locations, giving fleets greater flexibility while maintaining centralized payment management.
Market Expansion Drivers
- Rising fleet digitization accelerating adoption of cashless fuel expense management systems.
- Integration of telematics and analytics platforms improving fleet fuel optimization and operational visibility.
- Expanding multi-service mobility payment capabilities supporting mixed-energy commercial fleet operations.
Leading Market Participants
- Prominent companies in the fuel card market include WEX Inc. (United States), Corpay, Inc. (United States), Shell plc (United Kingdom), BP plc (United Kingdom), TotalEnergies SE (France), Exxon Mobil Corporation (United States), Chevron Corporation (United States), DKV Mobility Group SE (Germany), UTA Edenred SAS (France), Repsol S.A. (Spain).
Global Market Forecast Snapshot
Market Outlook
- 2026 Market Size: USD 960.7 billion
- 2027 Estimated Market Size: USD 1.07 trillion.
- Projected Market Size: USD 3.41 trillion by 2036
- Growth Forecast: 13.49% CAGR (2027-2036)
Regional and Segment Outlook
- Leading Regional Market: North America
- High-Growth Regional Hub: Asia Pacific
- Core Revenue Segment: Smart Cards (Technology) | Branded Fuel Cards (Type) | Fuel Refill (Application)
- Emerging Opportunity Segment: Standard Cards (Technology) | Universal Fuel Cards (Type) | Vehicle Service (Application)
Market Growth Drivers and Industry Trends
Rising fleet digitization accelerating adoption of cashless fuel expense management systems
Fleet digitization is reshaping the fuel card market as commercial operators increasingly replace manual fuel reimbursement and paper-based processes with electronic payment and expense management systems. Digital fuel cards provide centralized control over transactions, driver spending, fuel purchases, and account permissions, helping fleet managers improve administrative efficiency while reducing the risks associated with cash handling. Integration with digital fleet management workflows also allows businesses to consolidate fuel-related records and simplify reconciliation across distributed vehicle operations.
Integration of telematics and analytics platforms improving fleet fuel optimization and operational visibility
Integration with telematics and analytics solutions is strengthening the fuel card market by connecting transaction data with vehicle activity, route information, fuel consumption, and driver behavior. Fleet operators can use these combined insights to identify inefficient fueling patterns, detect unusual transactions, and better align fuel purchases with vehicle utilization. Real-time visibility into fleet performance also supports more informed decisions around routing, maintenance, and driver management, making fuel payment systems a more integral component of broader fleet optimization strategies.
Expanding multi-service mobility payment capabilities supporting mixed-energy commercial fleet operations
The expansion of multi-service payment capabilities is broadening the role of the fuel card market as commercial fleets adopt a combination of conventional and alternative energy sources. Modern mobility payment platforms can increasingly support a wider range of vehicle-related expenses, including charging, fuel, tolls, parking, and other mobility services through integrated payment arrangements. This flexibility is particularly valuable for fleet operators managing diverse vehicle portfolios, allowing businesses to centralize mobility expenditure while adapting payment processes to changing energy and transportation requirements.
| Growth Driver | Impact on CAGR | Regulatory Influence | Geographic Relevance | Adoption Rate | Impact Timeline |
|---|---|---|---|---|---|
| Rising fleet digitization accelerating adoption of cashless fuel expense management systems | 2.00% | Moderate | North America, Asia Pacific | High | Near Term |
| Integration of telematics and analytics platforms improving fleet fuel optimization and operational visibility | 1.80% | Moderate | North America, Europe | High | Mid Term |
| Expanding multi-service mobility payment capabilities supporting mixed-energy commercial fleet operations | 1.50% | High | Europe, Asia Pacific | Emerging | Long Term |
Unlock insights tailored to your business with our bespoke market research solutions.
Click to get your customized report now.
Regional Demand Dynamics
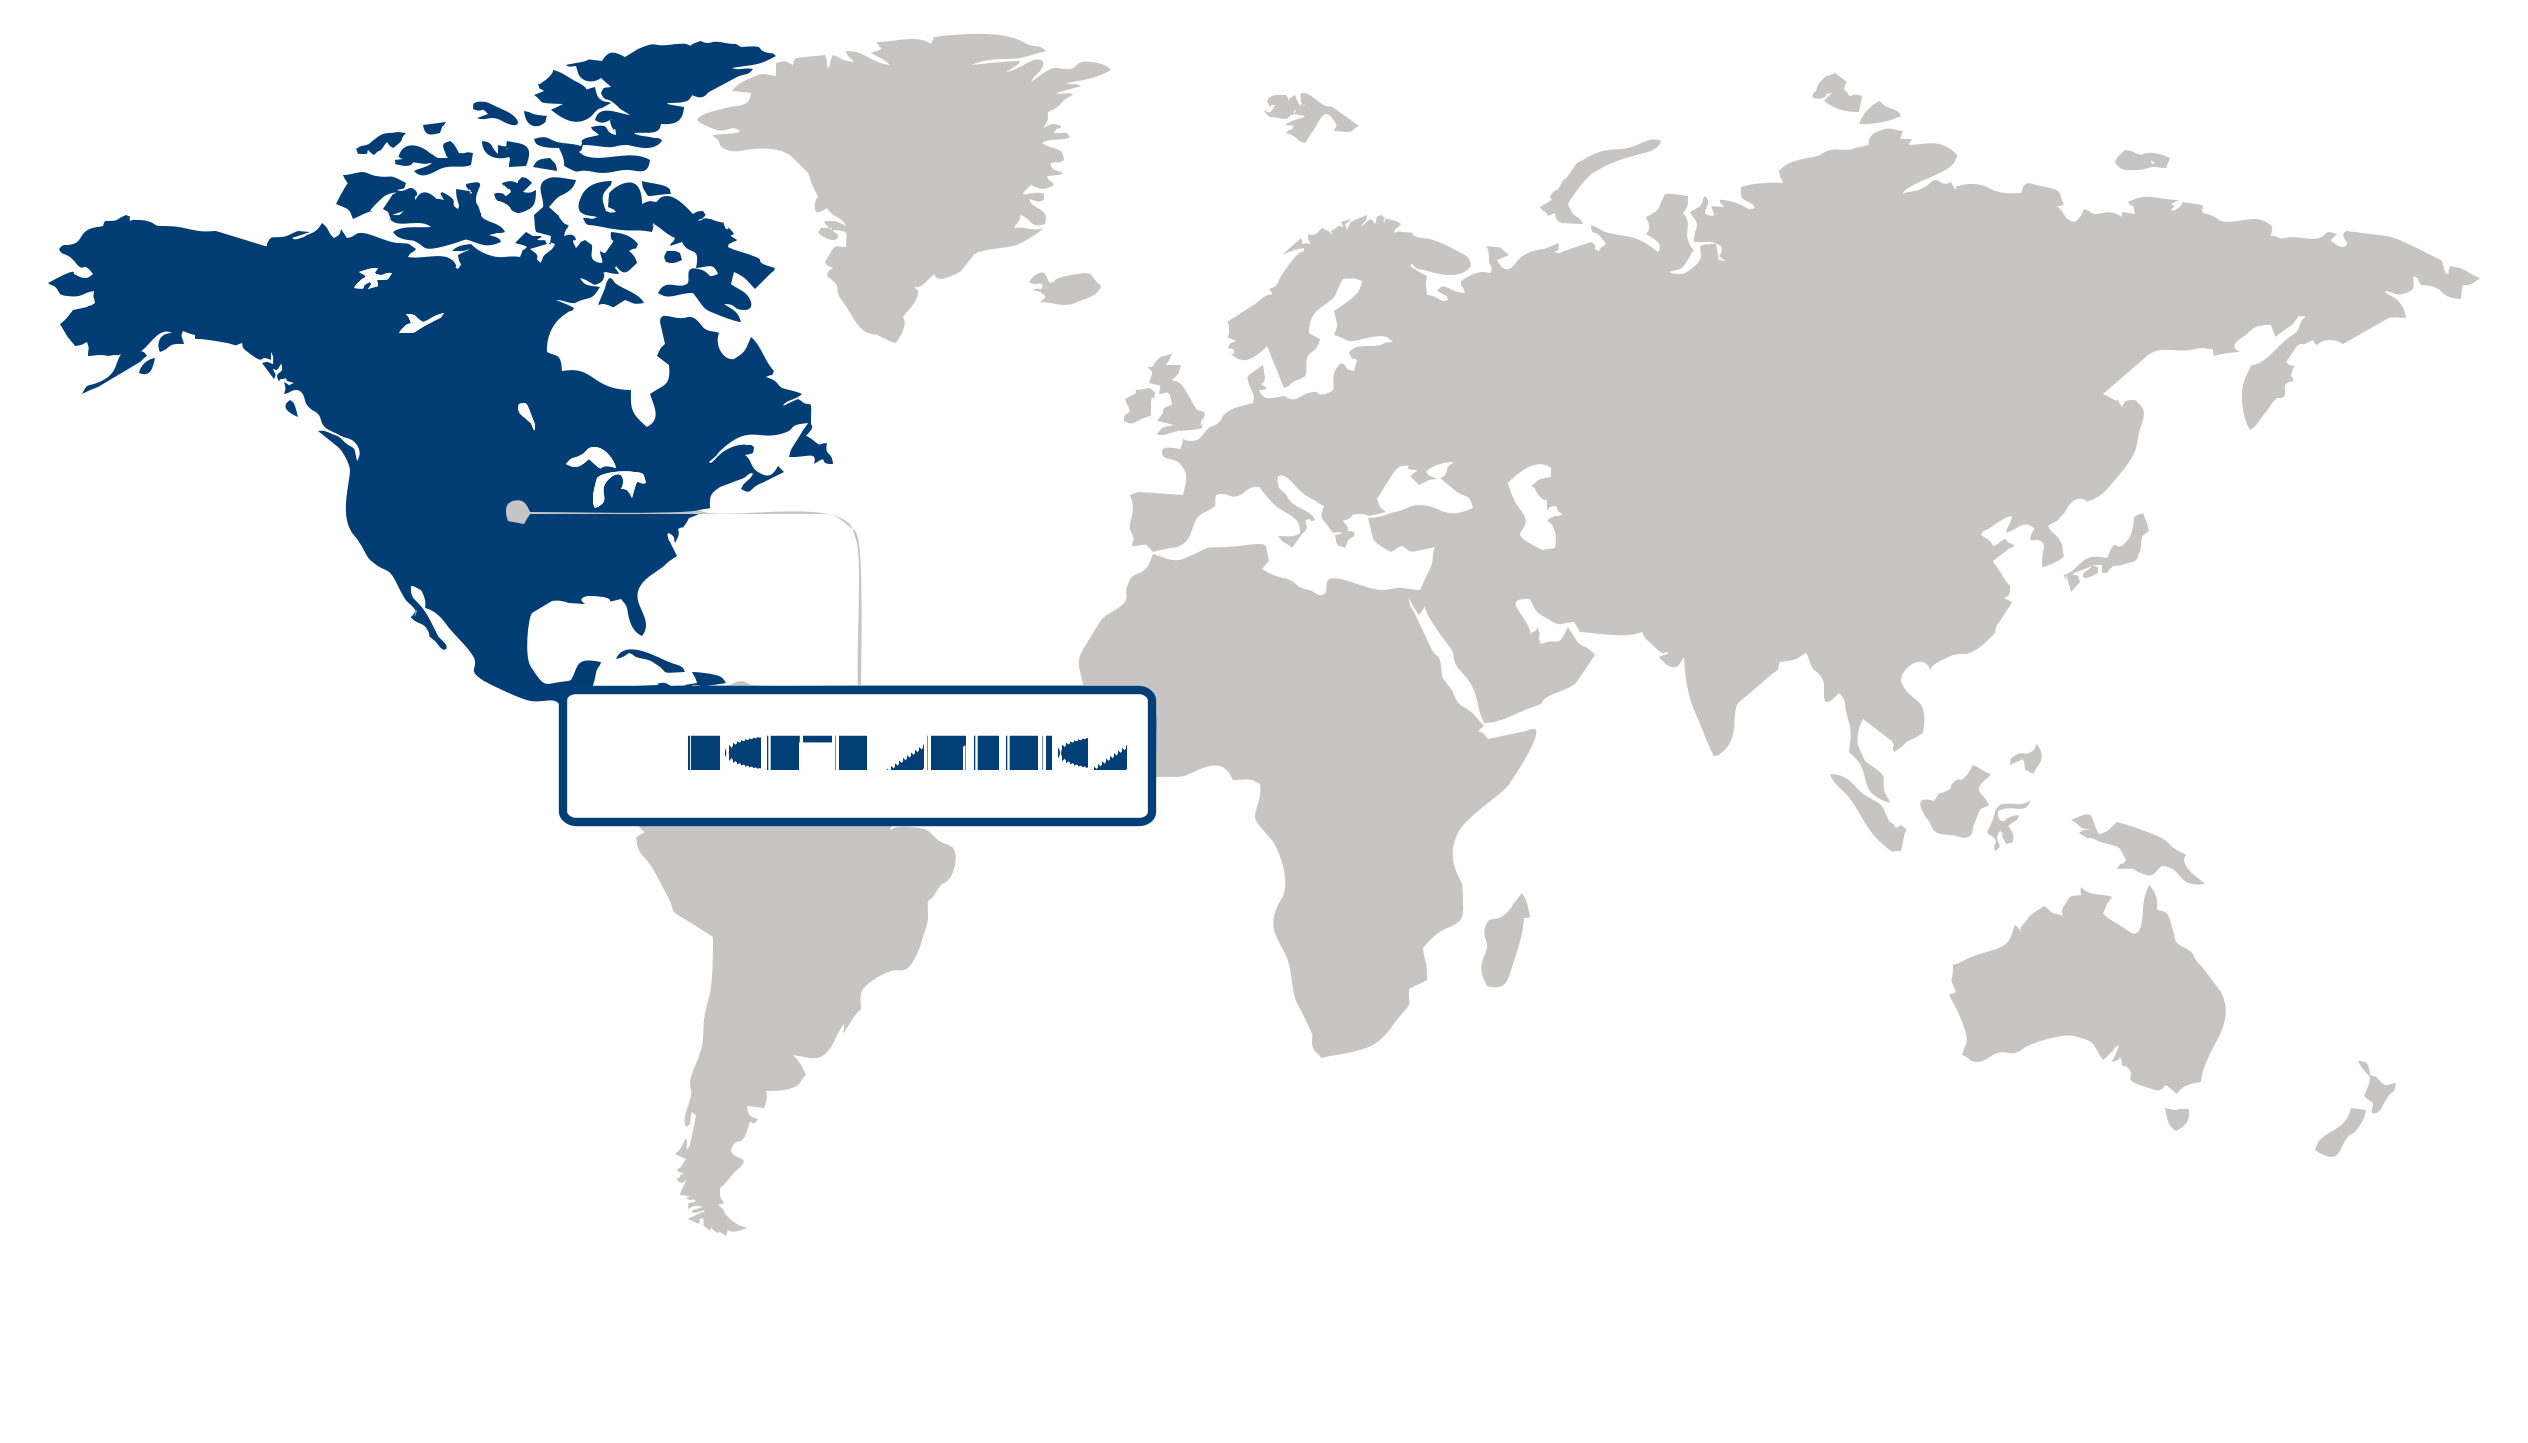
North America (Largest Region)
In the fuel card market, North America held the largest share in 2026, supported by the region’s extensive commercial transportation activity, established fleet management practices, and mature payment infrastructure. Fuel cards are widely integrated into business fleet operations because they provide centralized expense management, transaction visibility, and greater control over fuel-related spending. The presence of developed road networks and a large base of logistics, delivery, and service fleets further sustains demand. Increasing adoption of digital fleet management solutions and connected payment technologies is also strengthening the value of fuel cards by enabling more efficient monitoring, reporting, and operational decision-making.
Asia Pacific (Fastest-Growing Region)
Asia Pacific is experiencing the fastest growth, driven by expanding logistics networks, increasing commercial vehicle activity, and the continued development of organized fleet management systems. Rapid urbanization and the expansion of e-commerce and distribution activities are increasing the need for efficient fuel expense administration across business fleets. Financial technology adoption is also improving the integration of fuel payments with digital account management and fleet monitoring platforms. As businesses increasingly prioritize cost control, transaction transparency, and streamlined administrative processes, fuel cards are gaining relevance as part of broader efforts to modernize commercial mobility operations.
| Parameter | North America | Asia Pacific | Europe | Latin America | MEA |
|---|---|---|---|---|---|
| Innovation Hub i Scale Nascent Developing Advanced | |||||
| Cost-Sensitive Region i Scale Low Medium High | |||||
| Regulatory Environment i Scale Restrictive Neutral Supportive | |||||
| Demand Drivers i Scale Weak Moderate Strong | |||||
| Development Stage i Scale Emerging Developing Developed | |||||
| Adoption Rate i Scale Low Medium High | |||||
| New Entrants / Startups i Scale Sparse Moderate Dense | |||||
| Macro Indicators i Scale Weak Stable Strong |
Key Country Insights
Germany 🇩🇪
Commercial Fleet EfficiencyGermany focuses on fuel card programs that improve operational efficiency for logistics and commercial transport fleets. Businesses in Germany value broad fuel station acceptance, automated invoicing, and digital expense management to streamline fleet administration across regional and cross-border routes.
France 🇫🇷
Mobility Cost OptimizationFrance emphasizes fuel card services that help businesses manage transportation expenses while supporting diverse vehicle fleets. Companies across France increasingly adopt digital platforms that simplify payment administration, tax documentation, and operational monitoring for corporate mobility.
Italy 🇮🇹
SME Fleet ManagementItaly's fuel card market reflects strong demand from small and medium-sized fleet operators seeking practical expense control tools. Businesses in Italy prioritize flexible payment networks, simplified accounting processes, and improved visibility into vehicle-related operating costs.
Japan 🇯🇵
Corporate Mobility SolutionsJapan prioritizes fuel card offerings that integrate with corporate mobility programs and structured fleet administration. Companies in Japan increasingly seek secure digital payment capabilities and centralized transaction monitoring to improve operational transparency and cost control.
South Korea 🇰🇷
Digital Fleet PaymentsSouth Korea advances fuel card adoption through digital payment ecosystems and connected fleet technologies. Fleet operators in South Korea favor solutions that combine mobile accessibility, automated reporting, and efficient expense management for commercial transportation activities.
United States 🇺🇸
Fleet Payment IntegrationThe U.S. fuel card market emphasizes integrated payment platforms that connect fuel purchases with fleet management, telematics, and expense reporting. Businesses in the U.S. increasingly prioritize solutions that improve driver oversight, simplify reconciliation, and support multi-state fleet operations.
Segment Leadership and Growth Trends
Fuel Card Market Share (%), by Technology, 2026
Go beyond the chart, access full insights & data tables
Request Free Sample ReportTechnology Segment Analysis: Smart Cards (Largest Segment) vs Standard Cards (Fastest-Growing Segment)
The smart cards segment held the largest share in 2026, driven by the increasing need for secure and controlled payment solutions within commercial and fleet fuel management. Smart card technology can support stronger transaction authentication and facilitate the collection of detailed usage information, helping organizations improve oversight of fuel-related spending. Growing emphasis on fraud prevention, operational efficiency, and centralized expense management continues to reinforce the leading position of smart cards among businesses seeking greater control over fleet transactions.
The standard cards segment is the fastest-growing segment in the fuel card market, supported by their familiarity, ease of use, and accessibility across a broad range of users. These cards remain attractive where straightforward payment functionality and wide acceptance are key purchasing considerations. Growth is further supported by expanding adoption among smaller fleets and businesses that require practical fuel payment solutions without the need for more advanced transaction management capabilities.
Type Segment Analysis: Branded Fuel Cards (Largest Segment) vs Universal Fuel Cards (Fastest-Growing Segment)
Branded fuel cards held the largest share in 2026, supported by established fuel station networks and the convenience of integrated purchasing arrangements for regular fleet operations. These cards can provide businesses with streamlined access to preferred fuel outlets while simplifying expense tracking and payment administration. Their strong presence among organizations with predictable fueling patterns and established supplier relationships continues to support their dominant position.
In the fuel card market, universal fuel cards represent the fastest-growing segment as fleet operators increasingly prioritize flexibility across diverse fueling locations. Their ability to provide broader acceptance can be particularly valuable for businesses operating across multiple regions or managing vehicles with changing travel routes. Rising demand for simplified administration and greater choice in fuel purchasing is expected to continue supporting the adoption of universal fuel cards.
| Segment | Sub-Segment | Largest Segment | Fastest Growing |
|---|---|---|---|
| Technology | Smart Cards, Standard Cards | Smart Cards | Standard Cards |
| Type | Branded Fuel Cards, Universal Fuel Cards, Merchant Fuel Cards | Branded Fuel Cards | Universal Fuel Cards |
| Application | Vehicle Service, Parking, Fuel Refill, Toll Charge, Others | Fuel Refill | Vehicle Service |
Competitive Landscape and Market Positioning
Prominent players in the fuel card market:
1. WEX Inc. (United States)
2. Corpay Inc. (United States)
3. Shell plc (United Kingdom)
4. BP plc (United Kingdom)
5. TotalEnergies SE (France)
6. Exxon Mobil Corporation (United States)
7. Chevron Corporation (United States)
8. DKV Mobility Group SE (Germany)
9. UTA Edenred SAS (France)
10. Repsol S.A. (Spain)
The fuel card market is advancing through integration of digital payment technologies, real-time expense tracking, and intelligent fleet management platforms. Providers are enhancing data analytics capabilities and mobile accessibility to improve cost control and operational transparency for commercial fleets. Growing focus on fuel efficiency and automated transaction systems is shaping competitive dynamics within the market.
| Company | Market Share | Company Revenue | Revenue CAGR (%) | Product Portfolio | Geographic Presence | Innovation / R&D Focus | Strategic Developments |
|---|---|---|---|---|---|---|---|
| WEX Inc. (United States) | |||||||
| Corpay Inc. (United States) | |||||||
| Shell plc (United Kingdom) | |||||||
| BP plc (United Kingdom) | |||||||
| TotalEnergies SE (France) | |||||||
| Exxon Mobil Corporation (United States) | |||||||
| Chevron Corporation (United States) | |||||||
| DKV Mobility Group SE (Germany) | |||||||
| UTA Edenred SAS (France) | |||||||
| Repsol S.A. (Spain). |
Industry Development/News
| Company Name | Date | Key Development |
|---|---|---|
| bp / WEX Inc. | Aug-25 | bp partnered with WEX to launch the "earnify" fleet fuel card program in the U.S., integrating fuel payment processing with corporate loyalty rewards across a network of over 8,000 retail locations. The co-branded Mastercard infrastructure enables flexible purchasing controls for fuel, maintenance, and roadside assistance, backed by EMV chip security fraud prevention. |
| WEX Inc. | Apr-25 | WEX launched "WEX EV Depot," an integrated commercial charging solution that enables fleet operators to process electric vehicle (EV) charging payments across depot, public, and at-home infrastructure using a single WEX Fleet Card. The platform features RFID-secured transactions, mobile activation tools, and consolidated data analytics to manage mixed ICE and EV fleets under a unified credit line. |
| Nayax | Dec-24 | Nayax integrated fuel card payment processing capabilities across its global unattended retail and energy dispensing terminal network. The software deployment allows fleet operators to use commercial fuel cards at Nayax-powered EV charging stations and automated fuel pumps, driving cross-channel payment acceptance and modernizing mixed-fleet billing infrastructure. |
Customize Your Report
Explore examples of how this report can be tailored to different research needs, including custom segments, additional topics or chapters, and related reports. Click a section of the wheel or its numbered marker to explore the available options.
Fuel Card Market — Custom Segments
| Segment | Sub-Segment |
|---|---|
| Fleet Size | Small Fleets, Medium Fleets, Large Fleets |
| End-user Industry | Transportation & Logistics, Construction & Mining, Government & Public Services, Other Commercial Industries |
| Fleet Propulsion Type | Internal Combustion Engine, Hybrid Electric, Battery Electric |
Fuel Card Market — Custom TOC
| Custom Chapter | Custom Details |
|---|---|
| Fleet Payment Digitalization Strategy |
|
| Mobility Ecosystem Partnership Landscape |
|
| EV Charging Integration Readiness |
|
Need a different cut of the data?
Request Custom ResearchWhat is the current size of the fuel card market?
How is the fuel card industry size expected to evolve during the forecast period?
How is fleet digitization influencing adoption of fuel card solutions?
Why are multi-service mobility capabilities becoming strategically important in the fuel card market?
Why do Smart Cards hold the largest share of the fuel card market?
Which fuel card type is growing fastest in the fuel card market?
Why does North America dominate the fuel card market?
How is Asia Pacific expanding adoption of fuel card solutions?
Who are the leading players in the fuel card landscape?
Our Clients
"The team surpassed our expectations with the report depth. The actionable insights provided proved crucial in navigating market challenges."
Tata Motors
"We found the report to be very informative. The expertise and attention to market nuances significantly influenced our business direction."
DENSO Corporation
"The consumer survey findings were quite good. We now have a clearer picture of the customer churning and retention strategy."
HL Mando
Our Research Team & Methodology
Every Fundamental Business Insights report is built by a dedicated vertical research team, validated through a structured primary-and-secondary methodology, and reviewed for accuracy before it reaches you.
Research Team Overview
Prepared by the Automotive & Transportation Research Team
Delivery
Published
Demand
Available
Support
Trust & Compliance
Research Domains
10 coverage areasResearch Intelligence
| Source | Reference |
|---|---|
| International Organization of Motor Vehicle Manufacturers (OICA) | www.oica.net |
| SAE International | www.sae.org |
| International Energy Agency (IEA) | www.iea.org |
| International Transport Forum (ITF) | www.itf-oecd.org |
| International Road Federation (IRF) | www.irf.global |
| International Organization for Standardization (ISO) | www.iso.org |
| United Nations Economic Commission for Europe (UNECE) | unece.org |
| National Highway Traffic Safety Administration (NHTSA) | www.nhtsa.gov |
| U.S. Department of Transportation (USDOT) | www.transportation.gov |
| European Automobile Manufacturers' Association (ACEA) | www.acea.auto |
| Society of Indian Automobile Manufacturers (SIAM) | www.siam.in |
| International Air Transport Association (IATA) | www.iata.org |
| International Civil Aviation Organization (ICAO) | www.icao.int |
| International Maritime Organization (IMO) | www.imo.org |
| International Union of Railways (UIC) | uic.org |
| American Public Transportation Association (APTA) | www.apta.com |
| International Federation of Robotics (IFR) | ifr.org |
| CharIN | www.charin.global |
| World Shipping Council | www.worldshipping.org |
| International Federation of Freight Forwarders Associations (FIATA) | fiata.org |
Research Workflow & Quality Assurance
Data Collection
Verified information gathered through primary and secondary research.
Data Triangulation
Cross-validation using multiple independent data sources.
Forecast Modelling
Market estimates developed using historical trends and analytical models.
Analyst Validation
Findings reviewed by domain experts for accuracy and consistency.
Editorial & Quality Review
Final editorial, quality, and compliance checks before publication.
Final Publication
Released after successful completion of the internal review process.
Report Coverage
📊 Market Assessment
- Market Size & Forecast
- Market Segmentation
- Regional Analysis
- Growth Drivers & Challenges
- Market Dynamics
🏢 Competitive Intelligence
- Competitive Landscape
- Company Profiles
- Competitive Benchmarking
- Mergers & Acquisitions
- Market Share Analysis or Key Company Strategies
🔍 Strategic Analysis
- Value Chain Analysis
- Porter's Five Forces
- PESTLE Analysis
- Pricing Trends
- Supply-Demand Analysis
🚀 Future Outlook
- Technology Landscape
- Regulatory Landscape
- Investment & Funding Landscape
- Emerging Opportunities
- Future Market Outlook
Have a question about this report or need a custom scope?
Request Customization