


Knowledge Graph Market Size & Growth Forecast 2027–2036, By Segments (End User, Type, Organization Size, Data Source, Task Type, Application), Regional Demand Trends (North America, Asia Pacific, Europe), Key Country Insights (U.S., Japan, South Korea, Germany, France, Italy), and Competitive Landscape
Market Size and Growth Outlook
Knowledge Graph Market size was more than USD 1.65 Billion in 2026 and is set to grow at 20.18% CAGR between 2027 and 2036, reaching USD 10.37 Billion by 2036. The industry revenue for 2027 is estimated at USD 1.94 Billion.
Base Year Value (2026)
USD 1.65 Billion
CAGR (2027-2036)
20.18%
Forecast Year Value (2036)
USD 10.37 Billion

Historical Data Period
2022-2026

Largest Region
North America

Forecast Period
2027-2036
Knowledge Graph Market Intelligence Snapshot:
-
Regional Market Dynamics:
- North America held 37.8% in 2025, supported by strong AI, analytics, cloud computing, enterprise digitalization, and demand for connected data across industries.
- Asia Pacific is projected to grow fastest as enterprises invest in AI, cloud infrastructure, analytics, and digital transformation to integrate diverse information and improve decision-making.
-
Segment Momentum:
- BFSI accounted for a 24.84% share in 2025, supported by demand for connected data environments that enhance fraud detection, compliance, risk assessment, and customer intelligence.
- NLP knowledge graphs are expanding rapidly as organizations adopt AI-driven solutions for language understanding, information extraction, semantic search, and automated content analysis.
-
Market Expansion Drivers:
- Increasing need for seamless data integration across diverse enterprise information sources
- Growth of AI and machine learning applications accelerating knowledge graph deployment
- Rising enterprise focus on contextual analytics and decision intelligence driving adoption
-
Leading Market Participants:
Prominent companies in the knowledge graph market include Neo4j, Inc. (United States), International Business Machines Corporation (United States), Microsoft Corporation (United States), Google LLC (United States), Amazon Web Services, Inc. (United States), Oracle Corporation (United States), DataStax, Inc. (United States), Ontotext AD (Bulgaria), Stardog Union Inc. (United States), Franz Inc. (United States)
Global Market Forecast Snapshot:
-
Market Outlook:
- 2026 Market Size: USD 1.65 Billion
- 2027 Estimated Market Size: USD 1.94 Billion
- Projected Market Size: USD 10.37 Billion by 2036
- Growth Forecasts: 20.18% CAGR (2027-2036)
-
Regional and Segment Outlook:
- Leading Regional Market: North America
- High-Growth Regional Hub: Asia Pacific
- Core Revenue Segment: BFSI (End User) | Context-rich Knowledge Graphs (Type) | Large Enterprises (Organization Size) | Structured Data (Data Source) | Link Prediction (Task Type) | Semantic Search (Application)
- Emerging Opportunity Segment: Healthcare (End User) | NLP Knowledge Graphs (Type) | SME (Organization Size) | Unstructured Data (Data Source) | Entity Resolution (Task Type) | AI & Machine Learning (Application)
Market Growth Drivers and Industry Trends
Increasing need for seamless data integration across diverse enterprise information sources
Organizations are managing growing volumes of structured and unstructured information distributed across multiple business applications, databases, and digital platforms. This need for unified information management will drive the knowledge graph market growth as enterprises implement technologies capable of connecting diverse data sources into a coherent and searchable knowledge framework. By establishing meaningful relationships between previously disconnected datasets, knowledge graphs improve information accessibility, reduce data silos, and enable a more comprehensive understanding of business operations across complex enterprise environments.
Growth of AI and machine learning applications accelerating knowledge graph deployment
The expanding adoption of artificial intelligence and machine learning is increasing demand for high-quality contextual data that improves model accuracy and decision-making capabilities. The knowledge graph market benefits from this trend because knowledge graphs provide structured relationships and semantic context that enhance data interpretation for intelligent applications. Organizations are increasingly integrating knowledge graphs into AI workflows to support more accurate recommendations, advanced search capabilities, automated reasoning, and improved understanding of complex business information across multiple operational domains.
Rising enterprise focus on contextual analytics and decision intelligence driving adoption
Businesses are increasingly seeking analytical capabilities that move beyond traditional reporting by incorporating context, relationships, and interconnected information into decision-making processes. The knowledge graph market demand is expanding as organizations adopt knowledge-driven analytical frameworks that provide deeper insights into customers, operations, products, and business ecosystems. These platforms enable decision-makers to identify hidden relationships, improve information discovery, and strengthen strategic planning through richer contextual analysis that supports faster and more informed business decisions.
| Growth Driver Assessment Framework | |||||
| Growth Driver | Impact On CAGR | Regulatory Influence | Geographic Relevance | Adoption Rate | Impact Timeline |
|---|---|---|---|---|---|
| Increasing need for seamless data integration across diverse enterprise information sources | 2.1% | Moderate | North America, Europe | High | Near Term |
| Growth of AI and machine learning applications accelerating knowledge graph deployment | 2% | Moderate | North America, Asia Pacific | High | Near Term |
| Rising enterprise focus on contextual analytics and decision intelligence driving adoption | 1.6% | Low | Europe, North America | Medium | Mid Term |
Unlock insights tailored to your business with our bespoke market research solutions - Click to get your customized report now!
Regional Demand Dynamics
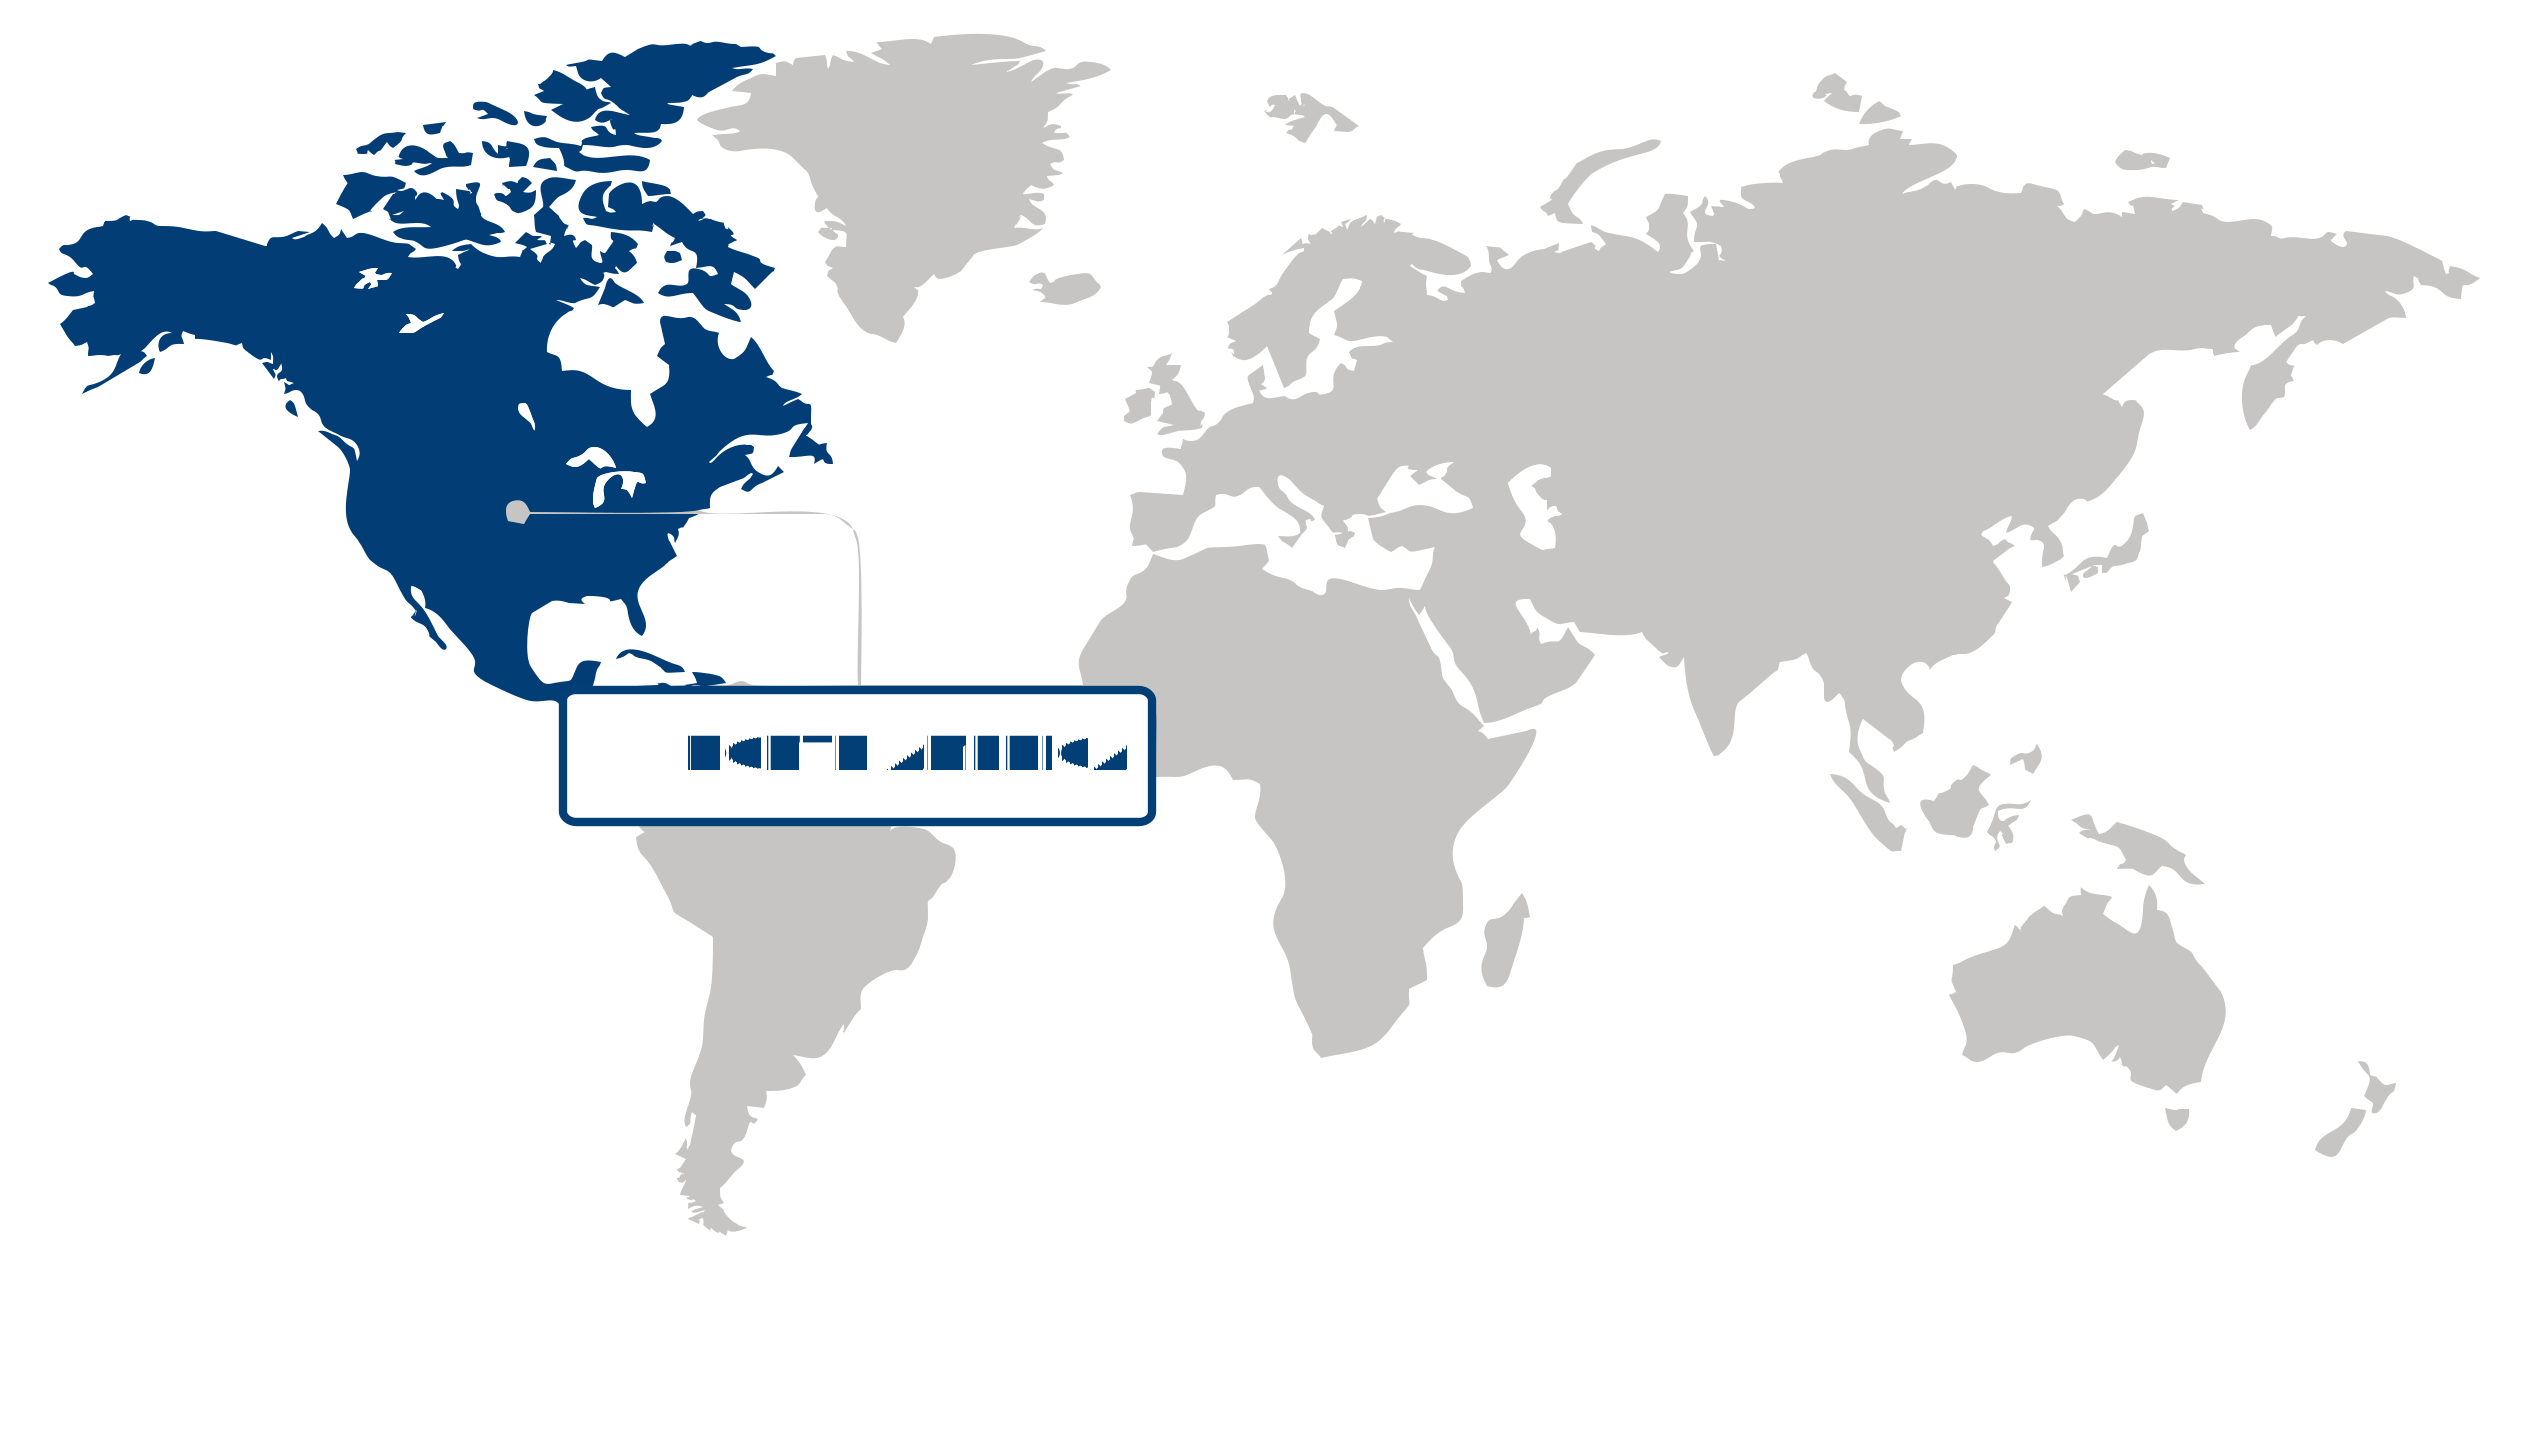
Largest Region
North America
37.8% Market Share in 2026
North America (Largest Region) vs Asia Pacific (Fastest-Growing Region)
North America held the largest share of 37.8% of the knowledge graph market in 2026, reflecting strong adoption of artificial intelligence, data analytics, cloud computing, and enterprise information management technologies. Organizations are increasingly using knowledge graphs to connect fragmented data, improve information discovery, and provide context for AI-driven applications. The region’s mature technology ecosystem and high level of enterprise digitalization support implementation across industries such as financial services, healthcare, technology, and professional services. Growing demand for intelligent search, personalized digital experiences, and more accurate AI outputs is further increasing the strategic importance of structured and interconnected data.
Asia Pacific is projected to be the fastest-growing region as enterprises accelerate digital transformation and expand their use of artificial intelligence and advanced data management technologies. Increasing investments in cloud infrastructure, analytics platforms, and AI-enabled business applications are creating favorable conditions for knowledge graph adoption. Organizations are seeking better ways to integrate information from diverse systems and improve decision-making, particularly as data volumes and digital operations expand. The development of smart enterprises and increasing technology investments across emerging economies are expected to broaden the use of knowledge graphs in areas such as customer analytics, search, recommendation systems, and enterprise intelligence.
No card data available for this language/report.
Segment Leadership and Growth Trends
End User Segment Analysis: BFSI (Largest Segment) vs Healthcare (Fastest-Growing Segment)
The BFSI segment held the largest share of 24.84% in 2026 in the knowledge graph market, supported by the industry's growing reliance on connected data environments for fraud detection, risk assessment, regulatory compliance, and customer intelligence. Financial institutions increasingly use knowledge graphs to unify structured and unstructured information from multiple internal and external sources, improving data accuracy and enabling more informed decision-making. The ability to establish complex relationships across transactions, customers, and financial entities has strengthened operational efficiency while enhancing governance and security initiatives.
The healthcare segment is emerging as the fastest-growing end-user category as healthcare organizations accelerate digital transformation and adopt advanced data integration platforms. Knowledge graphs help connect clinical records, research datasets, medical literature, and patient information into unified knowledge networks, supporting improved diagnostics, personalized treatment planning, and clinical research. Growing emphasis on interoperability, data-driven healthcare delivery, and intelligent decision support is expected to sustain strong momentum for this segment.
Type Segment Analysis: Context-rich Knowledge Graphs (Largest Segment) vs NLP Knowledge Graphs (Fastest-Growing Segment)
Context-rich knowledge graphs represented the largest type segment in 2026, driven by their ability to capture meaningful relationships, semantic context, and business-specific knowledge across diverse datasets. Organizations increasingly prefer these solutions because they improve search relevance, recommendation quality, enterprise knowledge management, and analytical capabilities. Their effectiveness in delivering contextual insights for complex decision-making has made them the preferred choice across data-intensive industries.
The knowledge graph market is witnessing rapid expansion in the NLP knowledge graphs segment as organizations seek more intelligent language understanding and automated information extraction capabilities. Advances in natural language processing have increased the demand for knowledge graphs that can transform unstructured text into connected knowledge networks, enabling conversational AI, document intelligence, semantic search, and automated content analysis. The growing adoption of AI-driven applications continues to reinforce the segment's growth trajectory.
Organization Size Segment Analysis: Large Enterprises (Largest Segment) vs SME (Fastest-Growing Segment)
Large enterprises accounted for the largest organization size segment in 2026, reflecting their extensive investments in enterprise data platforms, artificial intelligence, and digital transformation initiatives. These organizations manage vast volumes of distributed information across multiple business functions, making knowledge graphs valuable for integrating complex datasets and improving operational intelligence. Their greater financial resources and established IT infrastructure further support large-scale deployment and ongoing platform enhancement.
Small and medium-sized enterprises are becoming the fastest-growing segment as cloud-based deployment models and scalable knowledge graph solutions reduce implementation complexity and upfront investment requirements. Increasing awareness of data-driven decision-making, combined with the need to enhance customer insights, automate workflows, and improve business agility, is encouraging wider adoption among smaller organizations. As accessibility improves, SMEs are increasingly leveraging these technologies to strengthen competitiveness without extensive internal data infrastructure.
| Report Segmentation | |||
| Segment | Sub-Segment | Largest Segment | Fastest Growing Segment |
|---|---|---|---|
| End User | Healthcare, E-commerce & Retail, BFSI, Government, Media & Entertainment, Manufacturing, Transportation & Logistics, Others | BFSI | Healthcare |
| Type | Context-rich Knowledge Graphs, External-sensing Knowledge Graphs, NLP Knowledge Graphs | Context-rich Knowledge Graphs | NLP Knowledge Graphs |
| Organization Size | SME, Large Enterprises | Large Enterprises | SME |
| Data Source | Structured Data, Unstructured Data, Semi-structured Data | Structured Data | Unstructured Data |
| Task Type | Link Prediction, Entity Resolution, Link-based Clustering | Link Prediction | Entity Resolution |
| Application | Semantic Search, Recommendation Systems, Data Integration, Knowledge Management, AI & Machine Learning | Semantic Search | AI & Machine Learning |
 Read our Research Approach
Competitive Landscape and Market Positioning
Top players in the knowledge graph market:
- Neo4j, Inc. (United States)
- International Business Machines Corporation (United States)
- Microsoft Corporation (United States)
- Google LLC (United States)
- Amazon Web Services, Inc. (United States)
- Oracle Corporation (United States)
- DataStax, Inc. (United States)
- Ontotext AD (Bulgaria)
- Stardog Union, Inc. (United States)
- Franz, Inc. (United States)
The knowledge graph market is becoming increasingly competitive as providers move from foundational data modeling capabilities toward intelligent systems that improve enterprise decision-making and information discovery. Market participants are differentiating through the depth of their semantic frameworks, integration with complex data environments, and ability to support advanced analytics applications. Competition is also expanding between specialized graph technology providers and broader data platform players seeking to embed contextual intelligence into existing workflows. As organizations prioritize connected data architectures, vendors with strong interoperability and domain-specific expertise are gaining importance in shaping adoption.
Industry Development/News
| Company Name | Date | Key Development |
|---|---|---|
| GreenCore Solutions Corp. (GSC) | Jun-26 | GreenCore Solutions Corp. signed a definitive Asia-Pacific joint venture agreement alongside launching its AI Agent CPG Knowledge Graph platform. This strategic move expands its technical capabilities and accelerates regional commercialization of AI-driven procurement. |
| Neo4j | Jun-26 | Neo4j acquired Graph Aware to strengthen its enterprise graph analytics capabilities. The acquisition enhances the company's portfolio in semantic data management and expands its technical footprint in AI-driven knowledge graph applications. |
| Digital Science | Mar-26 | Digital Science acquired virtual knowledge graph specialist Ontopic to enhance its enterprise AI portfolio. The transaction strengthens the company's semantic data capabilities and expands its technology offerings for knowledge graph-based information management. |
| Zendesk | Dec-25 | Zendesk acquired enterprise search startup Unleash to enhance its AI-powered capabilities. The integration enables advanced knowledge discovery across connected business data sources, improving competitive positioning in enterprise intelligence. |
| TigerGraph | Nov-25 | TigerGraph secured a USD 105 million Series D funding round to accelerate its real-time graph analytics platform. The capital injection is earmarked for cloud-native GSQL development and expanding its commercial footprint across Asia-Pacific financial services markets. |
| Neo4j | Nov-24 | Neo4j secured a $50 million investment from Noteus Partners to reinforce its valuation and accelerate growth. The funding supports the ongoing development of its graph database and knowledge graph technologies ahead of a planned IPO. |
| Ontotext | Oct-24 | Ontotext merged with Semantic Web Company to form Graphwise. This combination of semantic AI and knowledge graph expertise expands enterprise technology offerings, driving market consolidation and strengthening the company's competitive presence. |
| Samsung Electronics | Jul-24 | Samsung Electronics acquired Oxford Semantic Technologies, a specialized knowledge graph startup. This strategic acquisition aims to enhance personalized user experiences by integrating advanced knowledge engineering and semantic web technologies with Samsung's on-device AI architecture. |
| Altair | Apr-24 | Altair acquired Cambridge Semantics to integrate analytical knowledge graph capabilities into its data analytics and generative AI portfolio. The transaction enhances Altair's competitive positioning by directly supporting enterprise data fabric initiatives. |
| Qloo | Feb-24 | Qloo raised $25 million in Series C funding to accelerate development of its AI-powered recommendation platform. The capital supports the expansion of knowledge graph technologies used to analyze consumer preferences and cultural data. |
Why Choose Us
Specialized Expertise: Our team comprises industry experts with a deep understanding of your market segment. We bring specialized knowledge and experience that ensures our research and consulting services are tailored to your unique needs.
Customized Solutions: We understand that every client is different. That's why we offer customized research and consulting solutions designed specifically to address your challenges and capitalize on opportunities within your industry.
Proven Results: With a track record of successful projects and satisfied clients, we have demonstrated our ability to deliver tangible results. Our case studies and testimonials speak to our effectiveness in helping clients achieve their goals.
Cutting-Edge Methodologies: We leverage the latest methodologies and technologies to gather insights and drive informed decision-making. Our innovative approach ensures that you stay ahead of the curve and gain a competitive edge in your market.
Client-Centric Approach: Your satisfaction is our top priority. We prioritize open communication, responsiveness, and transparency to ensure that we not only meet but exceed your expectations at every stage of the engagement.
Continuous Innovation: We are committed to continuous improvement and staying at the forefront of our industry. Through ongoing learning, professional development, and investment in new technologies, we ensure that our services are always evolving to meet your evolving needs.
Value for Money: Our competitive pricing and flexible engagement models ensure that you get maximum value for your investment. We are committed to delivering high-quality results that help you achieve a strong return on your investment.
Select Licence Type